Dashboard: Usage View
-
The Usage view shows write activity reported under the installed Quill license,
measured in Write Request Units (WRU).Open it under License & usage in the dashboard sidebar, at
https://dashboard.<your-domain>/usage. -
This is a license-wide view. If the same license is used by more than one Quill deployment,
the figures can include write usage from all those deployments. -
The view contains:
- A WRU chart that shows total write usage over the selected period.
- A Usage per app table that groups the selected period's usage by RavenDB database name.
-
Conversation, prompt, and token metrics are not shown in this view.
Find their combined totals under Activity in My apps for your Quill.
For a single app, use the Activity section of the app's Overview, or the app's Analytics view for breakdowns by capability, model, and channel. -
In this article:
Usage overview
-
Usage
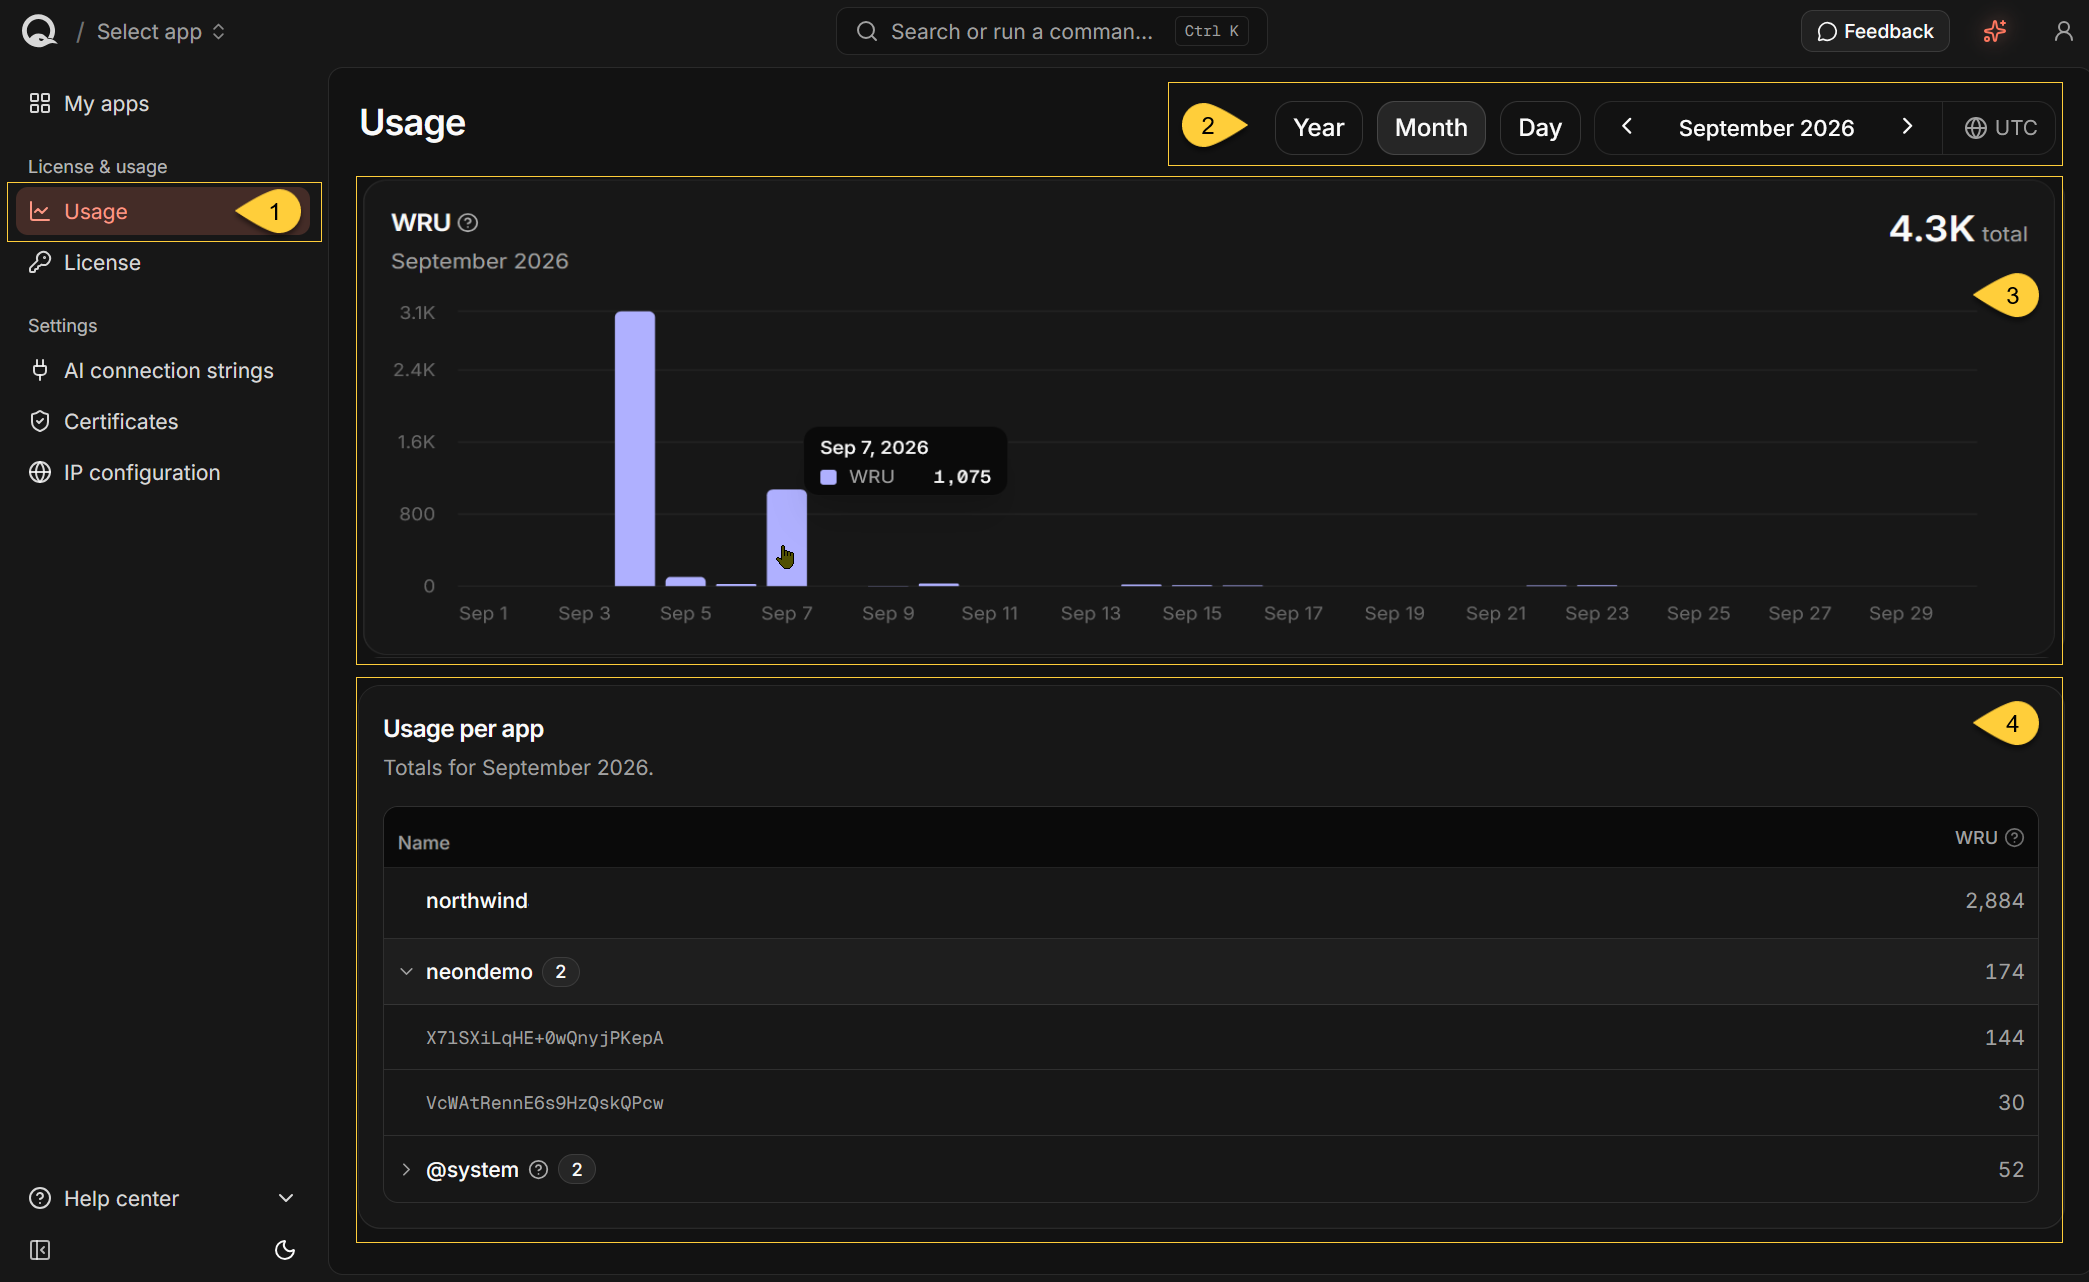
Select Usage under License & usage in the sidebar to open the view. -
Period selector
Choose Year, Month, or Day, and select the period to display.
The selection applies to both the chart and the table.
Available periods run from this Quill's first start date through today.
Periods and chart dates are in UTC, as the UTC indicator beside the period label reminds you. -
WRU
The chart shows the license-wide write usage for the selected period, divided into time buckets.
The total for the period appears on the right.
Learn more in Write usage (WRU) below. -
Usage per app
The table groups the selected period's usage by RavenDB database name.
For an app database, this is the app's slug, not its display name in My apps.
When more than one reported database has the same name, expand the row to see their topology IDs.
The Dashboard does not show which app or Quill deployment each topology ID belongs to.
The @system row contains Quill configuration-storage usage.
Learn more in Usage per app below.
Write usage (WRU)
What WRU counts
Write Request Unit (WRU) is the billing unit Quill uses for metered write activity.
Under Quill's pricing model, each document insert, update, or delete counts as one WRU, regardless of document size or ingestion speed.
Writes that count include:
- Quill's initial import and later mirroring of changes from a source relational database to an app's RavenDB database.
- Quill storing conversation messages in an app's RavenDB database.
- Generating embeddings for app data, which Quill's pricing model counts as writes rather than internal index maintenance.
- Applications writing directly to an app database with the RavenDB Client API.
- Quill writing to its own configuration storage, shown in the table as @system.
Reads, queries, and the indexes Quill maintains internally are not metered.
For current WRU billing rules and published plan allowances, see Quill pricing.
Usage is reported every 15 minutes, so recent write activity may not appear immediately.
For details about the installed license and its connectivity to RavenDB's licensing API,
open the License view under License & usage.
The chart
The selected period appears beneath WRU, with its total on the right.
The total uses compact number formatting, such as 1.1K or 18.4M.
Each bar represents one time bucket:
- Year - one bar per month.
- Month - one bar per day.
- Day - one bar per hour.
Every bucket from the start of the period up to the present appears on the horizontal axis.
A bucket with no reported usage has no bar.
Buckets and their labels are in UTC. The vertical axis shows abbreviated values, for example 1K.
Future buckets are not shown.
During the current period, the values can change when the view loads newer usage data.
Hover over a bar to see its UTC period, for example Sep 5, 2026, and its WRU.
Click a bar in the Year view to open that month, or in the Month view to open that day.
Bars in the Day view are not clickable because it already shows hourly buckets.
Usage per app
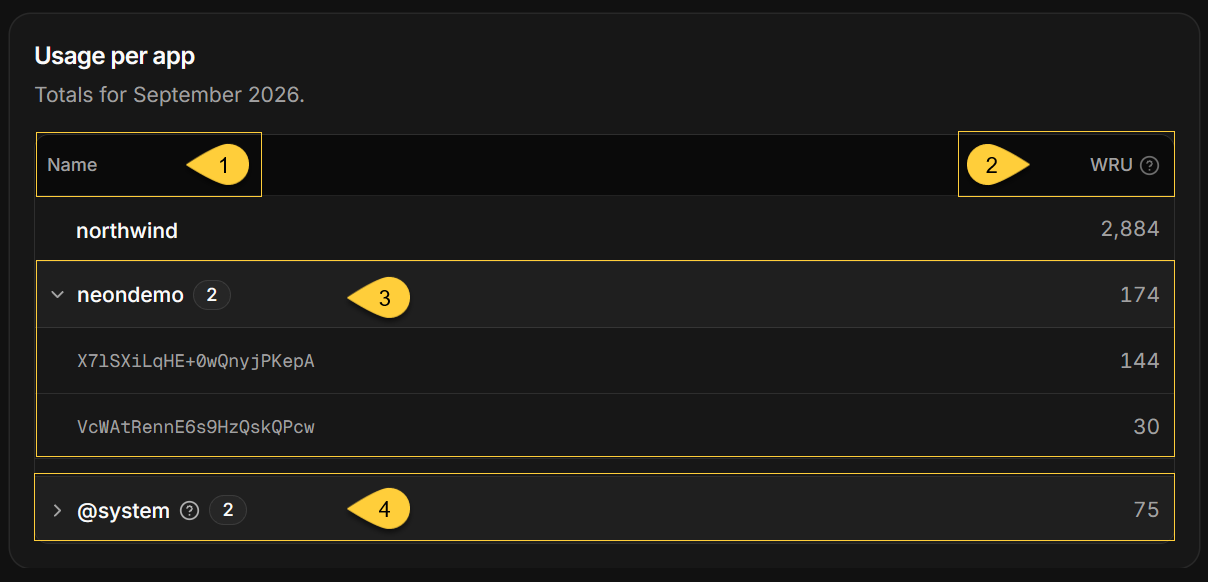
The Usage per app table groups the WRU reported for the selected period by RavenDB database name.
It is not scoped to a selected app and can include database usage from every Quill deployment using the installed license.
-
Name
The RavenDB database name reported for usage.
For an app database, this is the app's slug. -
WRU
The total write usage reported for the row during the selected period.
The non-system rows are ordered from highest to lowest WRU.
Rows with the same total are ordered by database name. -
Databases with the same name
When more than one database reports usage under the same name, the table combines them into one expandable row. The badge shows the number of databases, and the WRU column shows their combined usage.Expand the row to see each database's topology ID and individual WRU.
The expanded entries are ordered from highest to lowest WRU.-
The same database name can be reported more than once when:
- Multiple Quill deployments use the same license and contain app databases with the same name.
- Historical usage was reported for another database with the same name, such as after a database was deleted and recreated.
-
Each Quill app has one RavenDB database.
An expandable row does not mean that one app has multiple databases.
-
-
@system
Represents write usage from Quill configuration databases rather than app databases.
When present, it appears after the app database rows, and its usage is included in the license-wide WRU total.The badge shows the number of configuration databases in the group.
Expand the row to see each database's topology ID and individual WRU.
The row remains expandable when the badge is1.Its tooltip explains that Quill uses this storage for apps, channels, and API keys,
and that configuration changes count toward the total.
When no usage was reported for the selected period, the table displays No usage tracked yet.
App and deployment identification
-
The table does not currently provide the app display name or deployment identifier needed to map an entry to a specific app in My apps.
-
The topology IDs shown for grouped entries identify RavenDB database topologies. They are not app names or deployment identifiers, and the Dashboard does not show which app or Quill deployment each ID belongs to.
Why Usage can differ from My apps
-
The WRU tile under Activity in My apps totals write usage for the current apps in your Quill.
-
The Usage view is license-wide. Its totals can also include @system, databases from other Quill deployments using the same license, and historical databases that no longer belong to a current app.
-
The two views can therefore show different WRU totals for the same selected period.
Data freshness and errors
The Usage view shows write usage already reported under the installed license. It does not show the plan associated with the license, its included WRU volume, the remaining allowance, or resulting charges.
For published plan allowances and pricing, see Quill pricing.
To confirm the terms of your installed license, contact RavenDB sales.
-
The view does not poll for updates.
Reload the page, or leave the view and return later, to request newer figures.
Usage is reported every 15 minutes, so recent write activity may still take time to appear. -
If the usage request fails, the chart displays Could not load usage and the table displays "Could not load per-app usage". Select Retry in either card to request the usage data again.
This also happens when Quill cannot retrieve usage data from the license server.
To check the license's connectivity to RavenDB's licensing API, open the License view.