Set up Zabbix Monitoring for RavenDB Cloud


After setting up RavenDB and watching data flow smoothly between your app and a database, you realize that storing information is only half the story. The other half is keeping it nice and safe. That curiosity leads to monitoring. Tools designed to keep an eye on systems, servers, and networks in real time.
To monitor your database, one option is Zabbix. It's a handy tool that keeps an eye on your database and lets you know when something's not quite right. It tracks performance and storage metrics, so you can spot problems early and keep everything running smoothly. Let's see how to set it up.
Before we start deploying Zabbix in Docker, make sure you have the following prerequisites ready.
- Docker installed and running on your machine (this article was tested with Docker version 28.1.1)
- RavenDB Cloud instance
If you encounter any problems installing or starting Docker, refer to the official Docker documentation. A RavenDB Cloud instance is available at ravendb.net/cloud. In this article, we are using Windows. Remember to change commands if needed according to your operating system.
Setup
To set it all up, we will use a few Docker commands. Docker will make it easier for us to set up everything. Let's start by creating a dedicated network for all Zabbix components. Our Zabbix environment is made of several pieces that collect, process, and present monitoring data. The core components are: server, PostgreSQL database (stores configuration/history), Web frontend (GUI), agent (collects/forwards data)
Create the Docker network
Open your terminal and run the following command:
docker network create --subnet 172.20.0.0/16 --ip-range 172.20.240.0/20 zabbix-net
This creates an isolated Docker network named zabbix-net, ensuring all containers can communicate internally without interfering with other services.
Deploy the containers
Next, we want to create Zabbix containers inside Docker. We will need four containers, each setup with the command in the command prompt.
The first container will contain a PostgreSQL server. We create it using the following command, so we can collect our data and Zabbix config files:
docker run --name postgres-server -t `
      -e POSTGRES_USER="zabbix" `
      -e POSTGRES_PASSWORD="zabbix_pwd" `
      -e POSTGRES_DB="zabbix" `
      --network=zabbix-net `
      --restart unless-stopped `
      -d postgres:17
Next, we need an SNMP trap agent to extract the logs. SNMP is a protocol we use for communication and trap notification, which our agent will receive. We also need to expose port 162 for the trap to communicate. We will use the Alpine version of the Zabbix SNMP traps container.
docker run --name zabbix-snmptraps -t \
  -v /zbx_instance/snmptraps:/var/lib/zabbix/snmptraps:rw \
  -v /var/lib/zabbix/mibs:/usr/share/snmp/mibs:ro \
  --network=zabbix-net \
  -p 162:1162/udp \
  --restart unless-stopped \
  -d zabbix/zabbix-snmptraps:alpine-7.4-latest
Then we need a Zabbix server as a main component for Zabbix logic. It will connect the previous two containers, obtain data from Zabbix traps, and store them in the PostgreSQL server.
docker run --name zabbix-server-pgsql -t `
      -e DB_SERVER_HOST="postgres-server" `
      -e POSTGRES_USER="zabbix" `
      -e POSTGRES_PASSWORD="zabbix_pwd" `
      -e POSTGRES_DB="zabbix" `
      -e ZBX_ENABLE_SNMP_TRAPS="true" `
      --network=zabbix-net `
      -p 10051:10051 `
      --volumes-from zabbix-snmptraps `
      --restart unless-stopped `
      -d zabbix/zabbix-server-pgsql:alpine-7.4-latest
And the last thing we need is a web interface so we can interact with this. It's added with the last container.
docker run --name zabbix-web-nginx-pgsql -t `
      -e ZBX_SERVER_HOST="zabbix-server-pgsql" `
      -e DB_SERVER_HOST="postgres-server" `
      -e POSTGRES_USER="zabbix" `
      -e POSTGRES_PASSWORD="zabbix_pwd" `
      -e POSTGRES_DB="zabbix" `
      --network=zabbix-net `
      -p 443:8443 `
      -p 80:8080 `
      -v /etc/ssl/nginx:/etc/ssl/nginx:ro `
      --restart unless-stopped `
      -d zabbix/zabbix-web-nginx-pgsql:alpine-7.4-latest
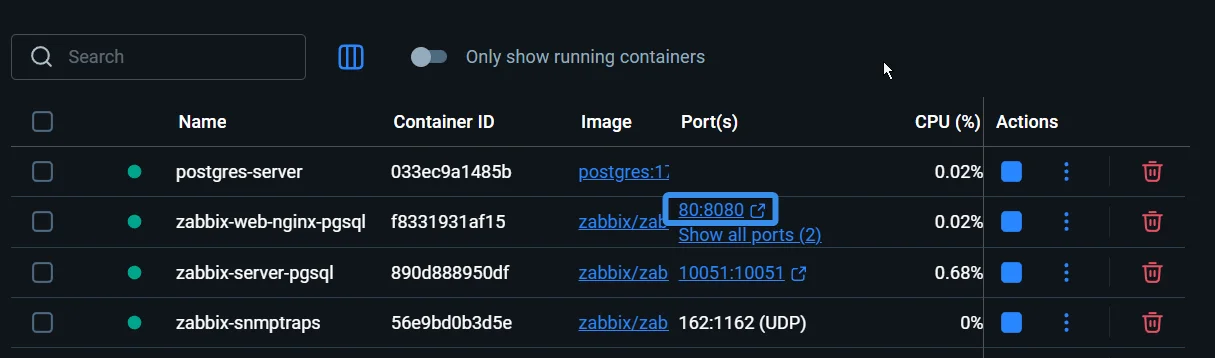
Those four containers are the whole Zabbix environment. Now we need to connect it to our RavenDB Cloud instance.
Log in to Zabbix
Let's first log in to Zabbix with default credentials. You can enter webUI clicking at port next to the web container or by navigating to http://localhost:80.
You should see something like this:

There, you want to input default login credentials:
Username: Admin
Password: zabbix
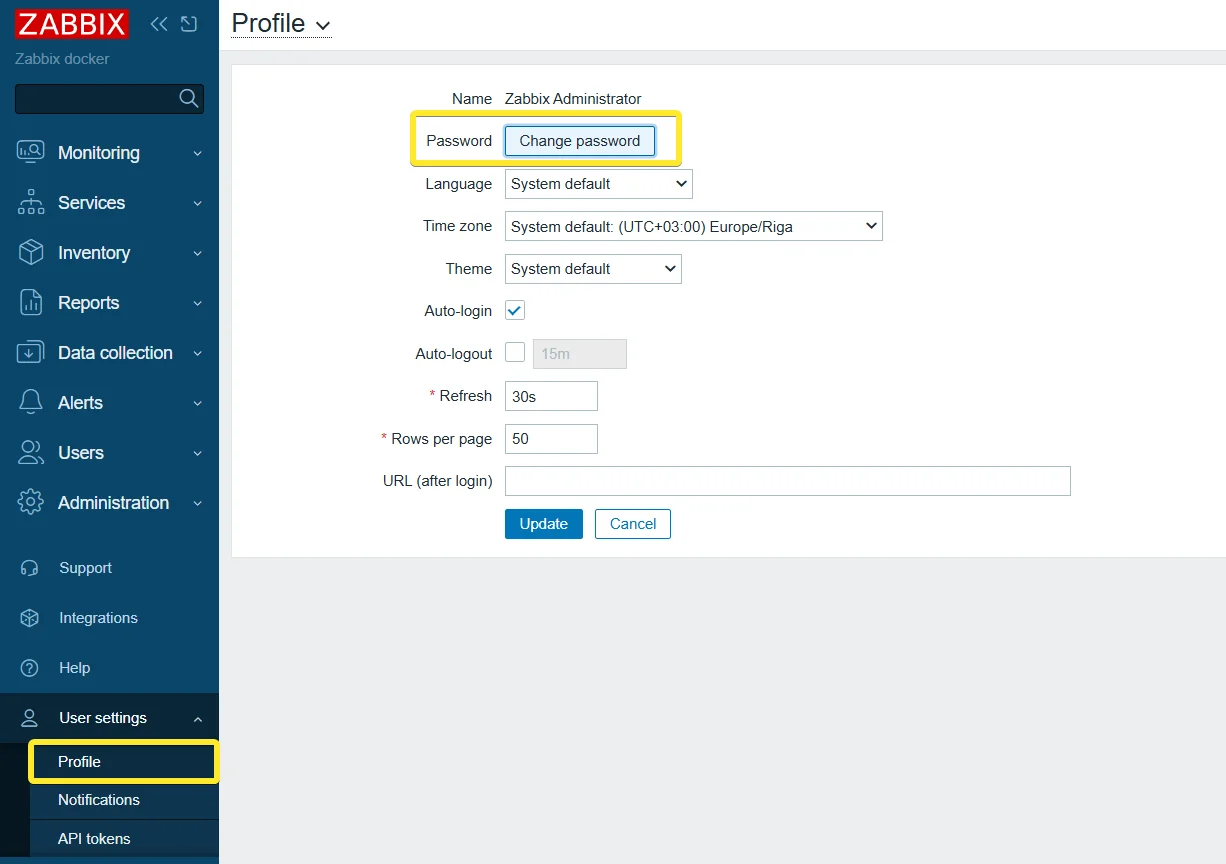
Once we log in, it's worth changing the default credentials to something more secure. Let's select User Settings on the left, then the profile tab and change your password.
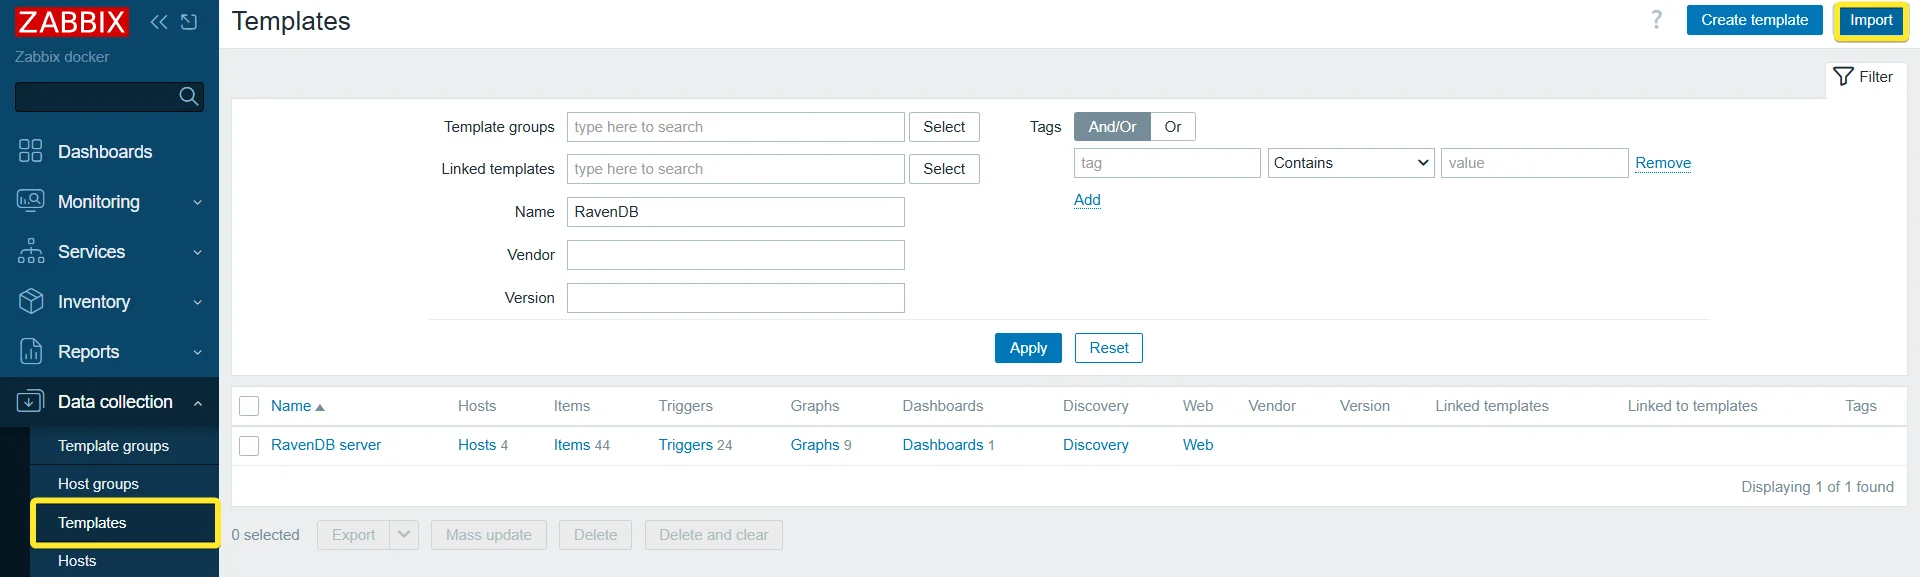
Let's add a RavenDB template we will use later. Templates can be downloaded from Zabbix community github. With the file downloaded, enter Data Collection and Templates. On the top right corner click import and select our file.
Connecting to RavenDB
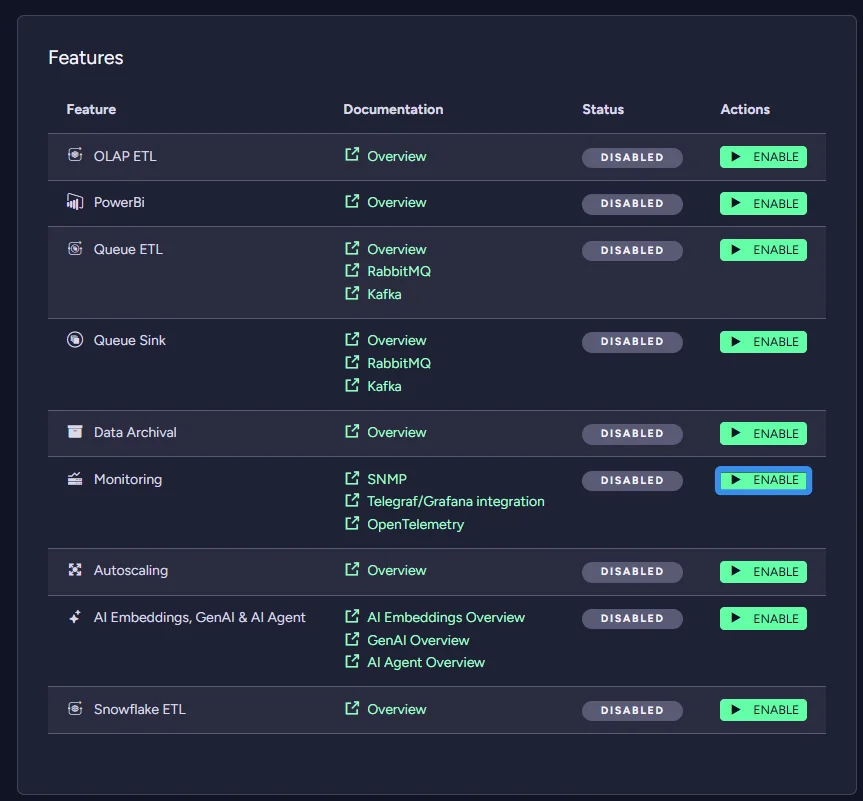
Now that we have the base for what we want to do let's connect your RavenDB Cloud. First we need to turn on the monitoring product feature. You can do it in the Manage page of your chosen RavenDB Cloud instance.
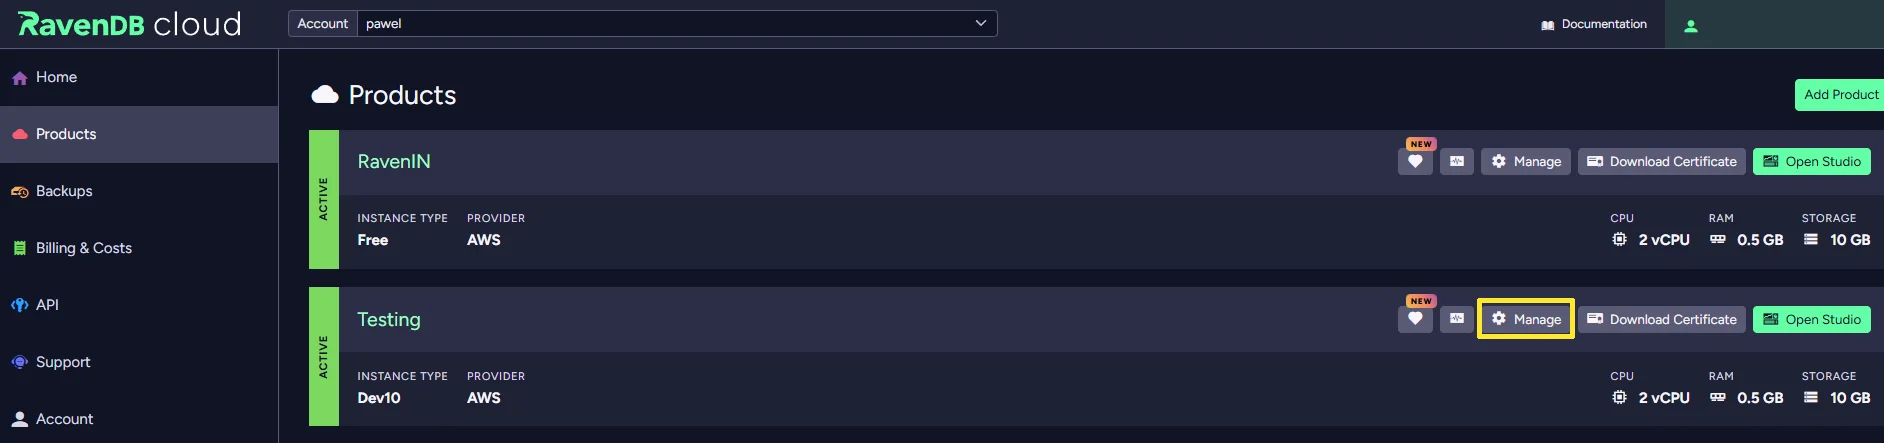
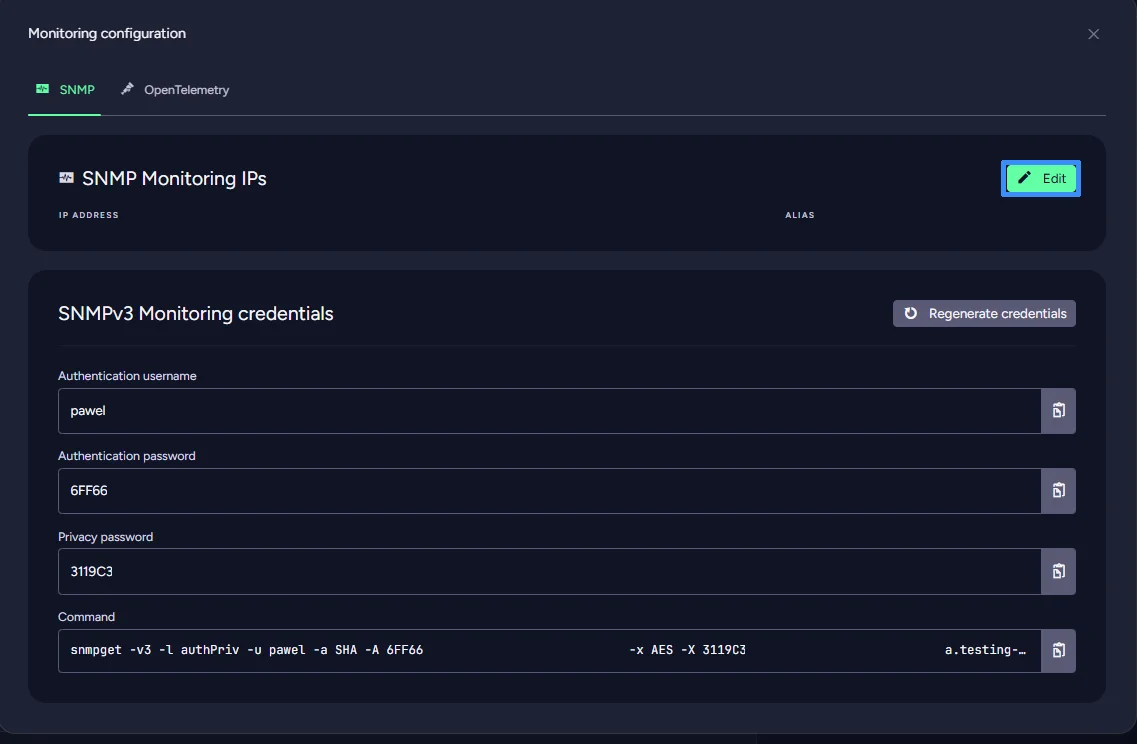
In the product features, find the Monitoring option and enable it. We need SNMP credentials to connect with Zabbix. Just follow the configuration menu that you can open by pressing the button that will appear under where the enable button was.
Inside, you want to copy three things: authentication username, authentication password and privacy password. RavenDB is designed to be safe, so to ensure that we use SNMPv3, we use two passwords. Also, add IP you will be connecting to on top.
Now we go back to Zabbix and click on monitoring on the left bar and hosts. Then on the top right corner of the screen, hit create host.
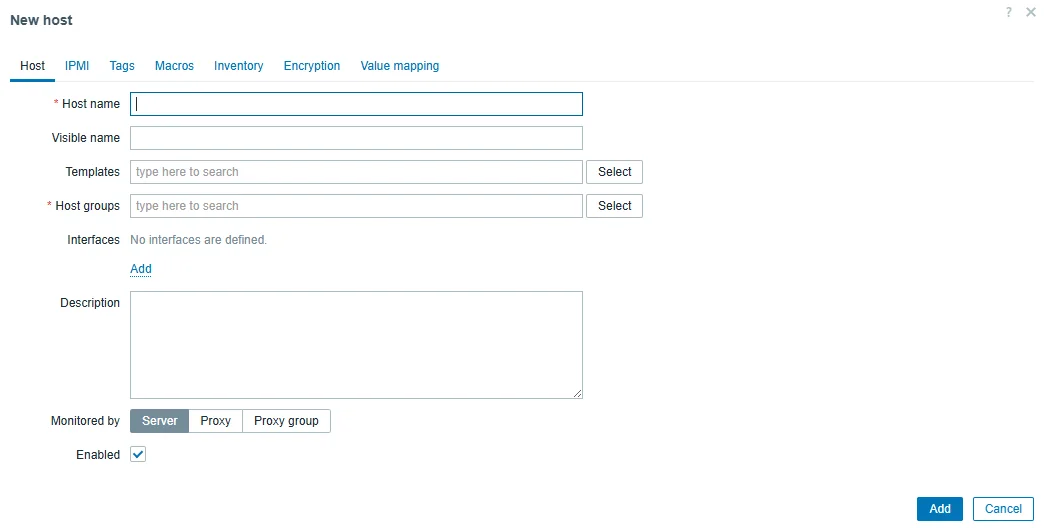
What you need to do here is (In brackets, you have RavenDB Cloud configuration names):
- Add Host Name
- Select RavenDB server as template
- Select/create Host Group
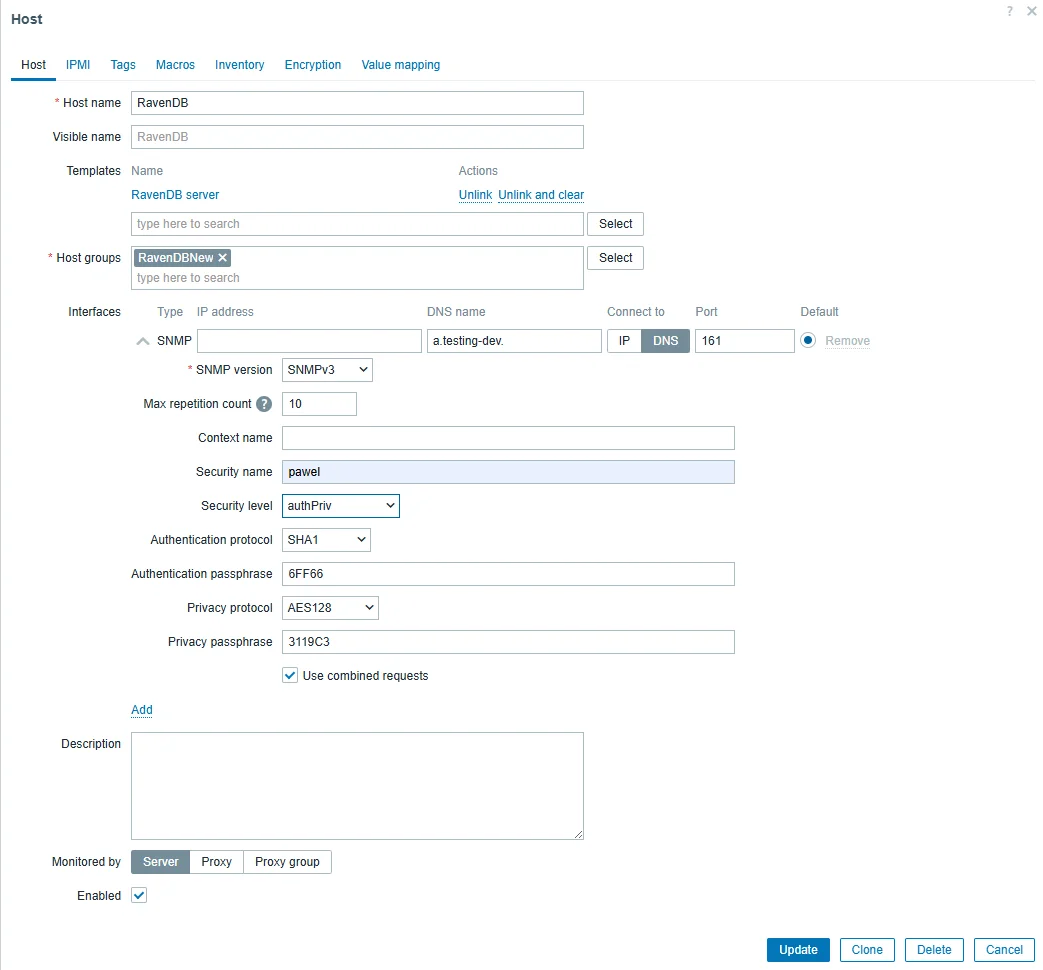
- Add SNMP interface
- Add your database address in DNS and switch to DNS connection
- Select SNMPv3
- Add your security name (Authentication username)
- Change security level to authPriv
- Select SHA1 and add your Authentication passphrase (Authentication password)
- Select AES128 and add your Privacy passphrase (Privacy password)
- Save
That's it. If done correctly, you should be able to go into the latest data, select everything, and at the bottom of the page, click execute now. After a few seconds and a refresh, you should have data in your Zabbix. You can check all monitored metrics at this page.
Let's go to data collection and hosts. There are click triggers at your new host. You can see that we already have some triggers inside from the template. If they satisfy your needs, you are done; if not, let's add a new one. On the top right corner of the screen, press Create Trigger.
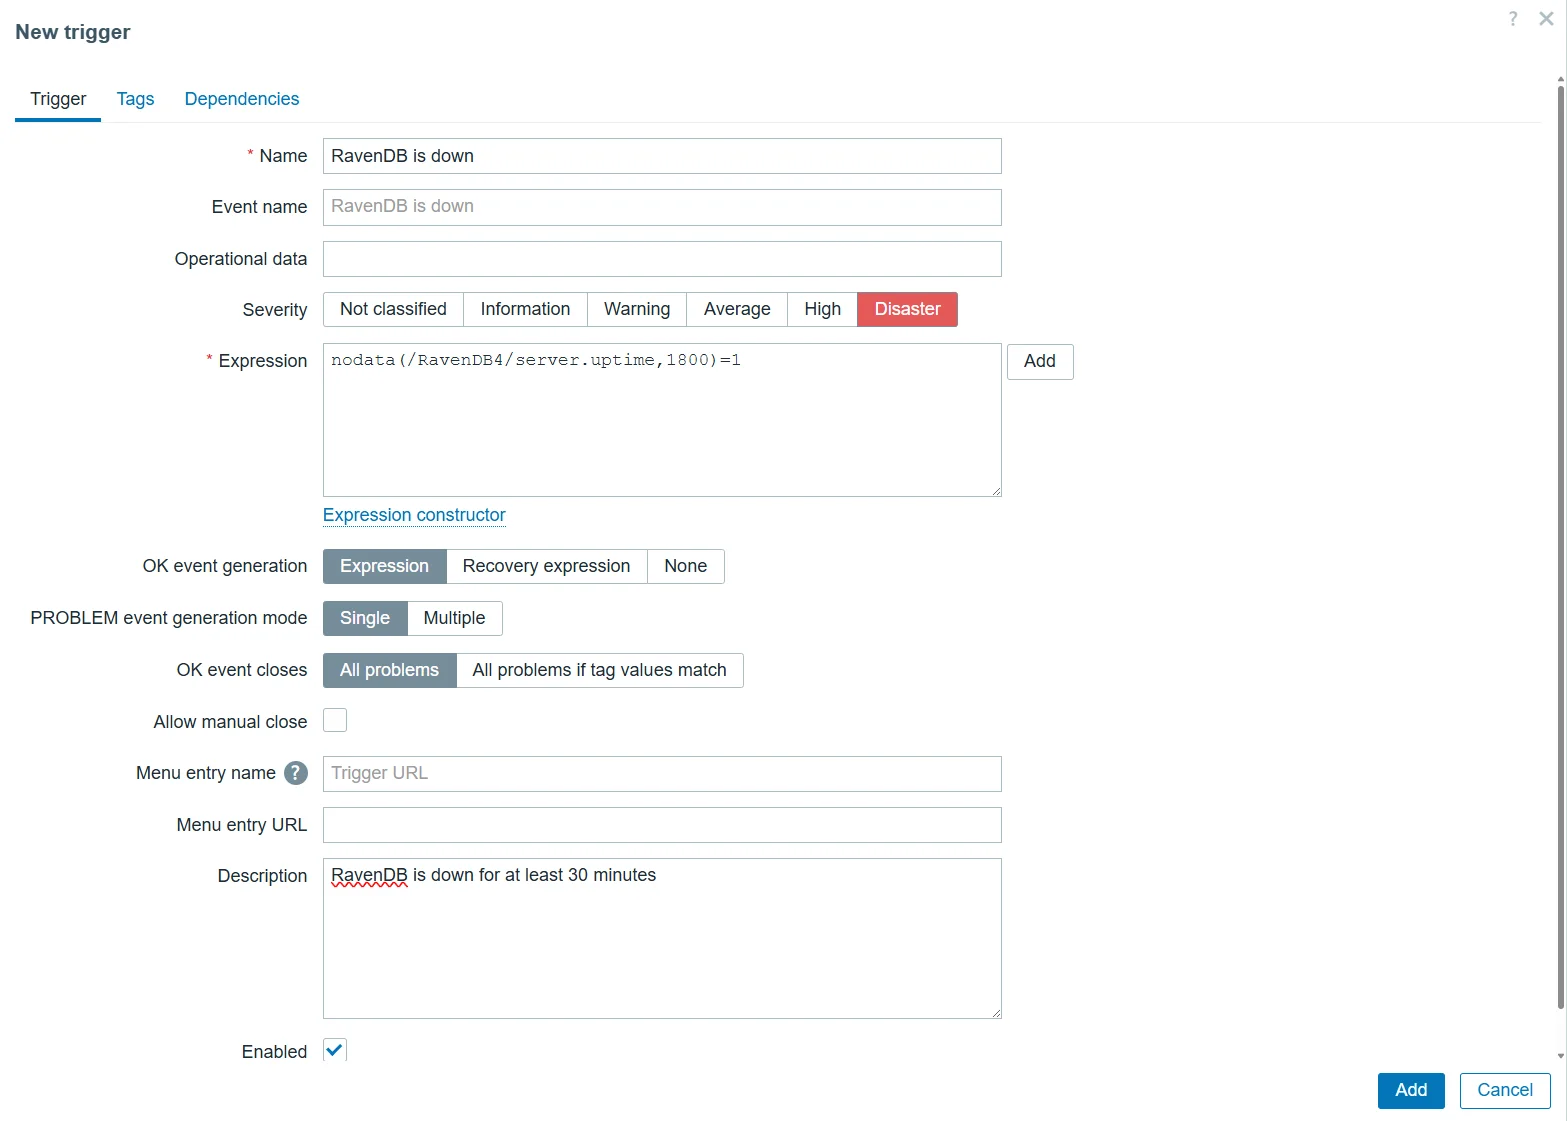
We can add an expression in two ways. Either use the editor by pressing add or just typing it. We want to create information that will inform us that our database has been down for the last 30 minutes. Our expression will look like this.
nodata(/RavenDB4/server.uptime,1800)=1
This gives you a trigger; now, you can add an option to send a message to your email address. If you want to learn how to do it you can check Zabbix documentation here.
That gives you a basic alerting setup for your RavenDB instance. Of course that's not all as Zabbix gives you the ability to create informative dashboards. RavenDB template gives you one with basic capabilities, but we can expand it.
Adding New Items
If your system depends on ETL or AI tasks, you probably want to know the moment something starts malfunctioning. That is exactly what the ETL Errors and AI Task Errors metrics are meant for.
Those metrics become especially useful in production environments. RavenDB Studio already provides dedicated ETL Errors and AI Task Errors views that make troubleshooting much easier than relying on notifications alone, but monitoring solves a different problem: finding out about failures before your users do. Having your users notice problems before you might already create new ones as you lose reputation, so you want to find issues before anyone notices. With monitoring in place, you can detect those failures immediately, receive alerts as soon as problems start appearing, and then move to RavenDB Studio to investigate the exact cause in detail.
To add those metrics to Zabbix, go to Data Collection, then Templates and open your template's Items section. Click Create Item, then provide the item name and key (used, for example, in expressions while configuring triggers), and change the type to SNMP Agent. Next, open RavenDB Studio and modify the URL so it ends with /monitoring/snmp/oids, for example:
http://[YOUR_URL]/monitoring/snmp/oids
Next, find the OID (Object Identifier) you want to monitor. In our case, it is listed under "Number of ETL Errors" in the Server section. Copy that value and paste it into the SNMP OID field.
After filling in the remaining settings, your item configuration should look similar to this:
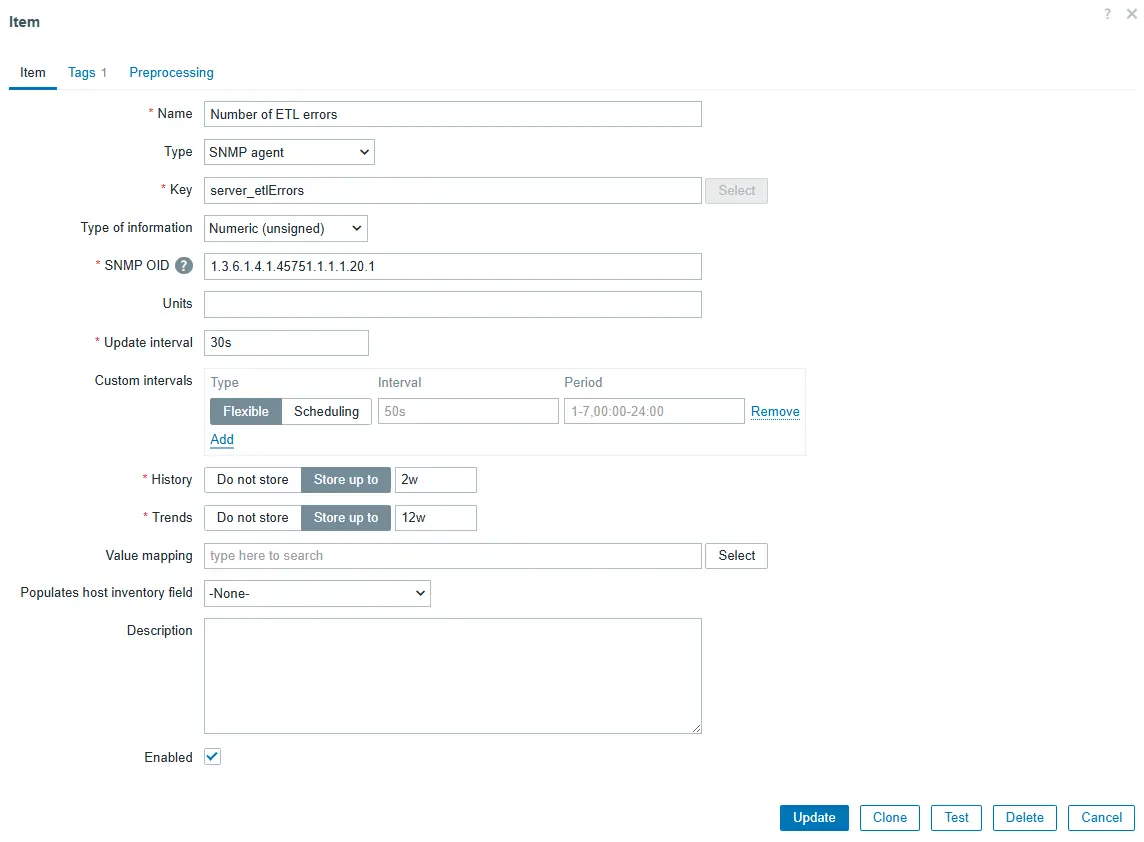
This gives us an item that monitors all ETL errors on the server. Depending on your system's needs, you might also want to add additional items, such as Impaired ETL Tasks or Failed AI Tasks. Those items can be used for triggers we showed you earlier or be added to Dashboard.
Trigger expression that would be using such item would look like:
last(/YourHostName/server_etlErrors)>0
If we add more ETL related items in dashboards it can present itself like this.
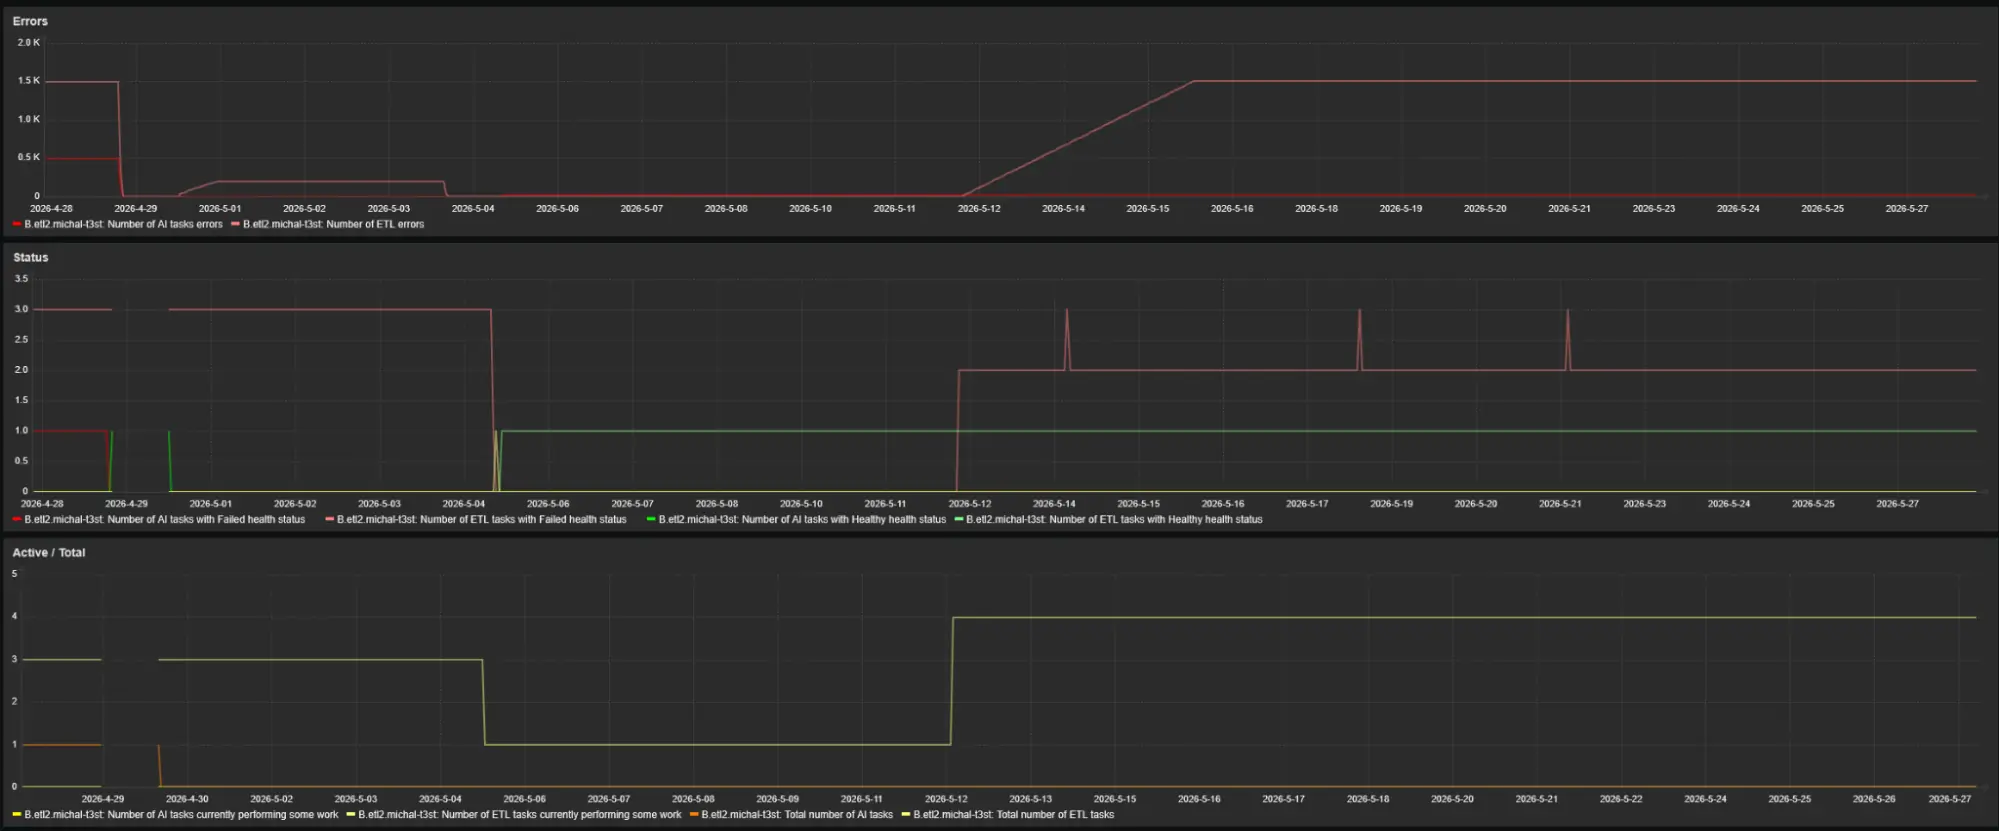
What you can see here is the result of our tests. The first graph shows the AI Task and ETL error counts across all databases. This is also the graph you can influence the most directly. Those sharp drops in the error count are not automatic; they correspond to us clearing errors in the ETL Errors view in RavenDB Studio.
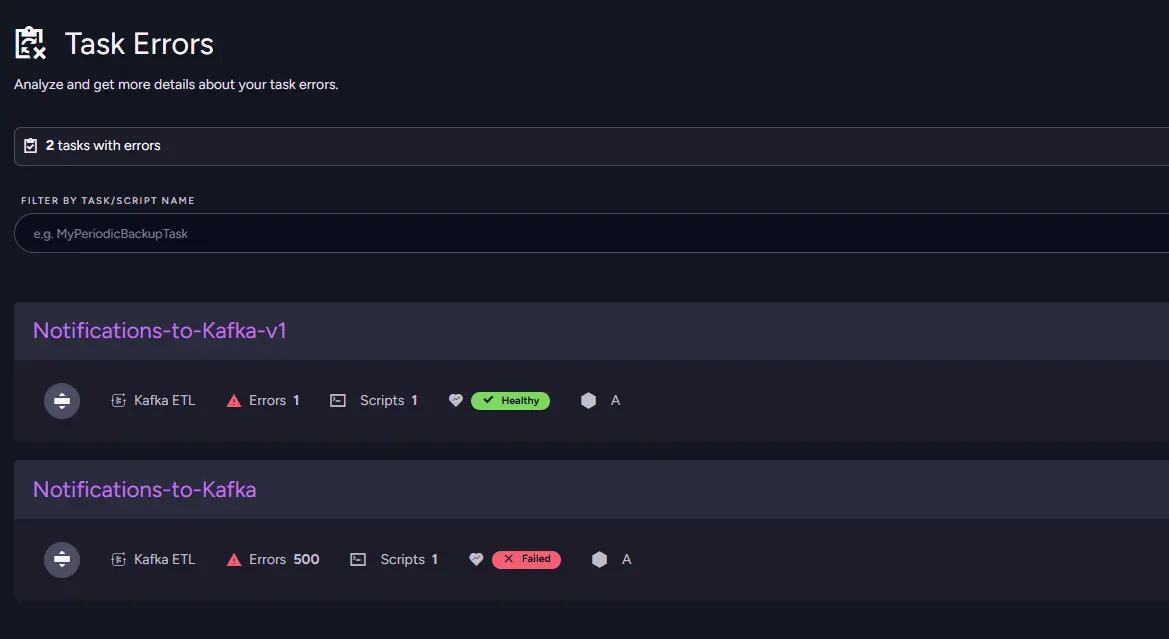
We can then open the database and confirm that the errors are indeed present there.
Going back to Zabbix, we can also see additional information there. The status graph represents the health states of our ETL tasks, so there's no need to open RavenDB Studio just to check how many tasks are affected.
The third graph shows how many ETL tasks are actively processing work at any given moment. If a task stops working because of an issue, you will notice it here immediately. With tools like these, you can keep track of your RavenDB environment without even opening Studio.
Summary
- The full Zabbix stack runs as four Docker containers on an isolated network: a PostgreSQL database, an SNMP trap receiver, the Zabbix server, and an Nginx web frontend.
- RavenDB Cloud exposes SNMP monitoring through a built-in product feature that provides an SNMPv3 authentication username, authentication password, and privacy password for secure integration.
- Importing the community RavenDB template from the Zabbix GitHub repository gives you a ready-made set of triggers and a dashboard without manually defining every metric.
- Custom SNMP items for ETL Errors, Impaired ETL Tasks, and Failed AI Tasks can be added to the template using OIDs from the
/monitoring/snmp/oidsendpoint, then wired to triggers and dashboard graphs for proactive alerting before users notice a problem.
If you are interested in monitoring your on-premise database, you can try using Datadog. You can check the connection tutorial here.
Interested in RavenDB? Grab the developer license dedicated to testing here or get a free cloud database here. Any questions about this feature or just want to hang out and talk with the RavenDB team? Join our Discord Community Server - invitation link is here.