What Requests Hit My Cloud Cluster?

Have you ever tried to make a query to your database while creating an app, but it didn't respond? Or maybe you noticed high activity on your database, but nothing happens within the data? If those problems sound familiar or you just want to know how to check how your database is doing, then you are in the right place. Everything below works on any RavenDB instance, but we are looking at it from a RavenDB Cloud cluster, where you get the Studio on every node plus the Cloud Portal sitting on top of them. Let's dive in and see where you can check your activity.
Highlights
- Use Traffic Watch to see current requests, response sizes, durations, warnings, and errors on the node you are connected to.
- Download Admin Logs when you need historical request data for deeper troubleshooting.
- Check Audit Logs to see who accessed the database and what actions were performed.
Where to check request activity on your cluster
Traffic Watch
To gain a more precise view of your current database status, consider using Traffic Watch. If you need to know every current connection to your instance, this feature will help you. You can access Traffic Watch by going to 'Manage Server' and selecting 'Traffic Watch' from the left-side menu.
One thing to keep in mind on a cluster: Traffic Watch shows you the traffic of the node you are currently connected to, not the whole cluster. If you are hunting a request and it isn't showing up, open the Studio on the other nodes as well. In the Cloud Portal every node in your cluster has its own Studio URL.
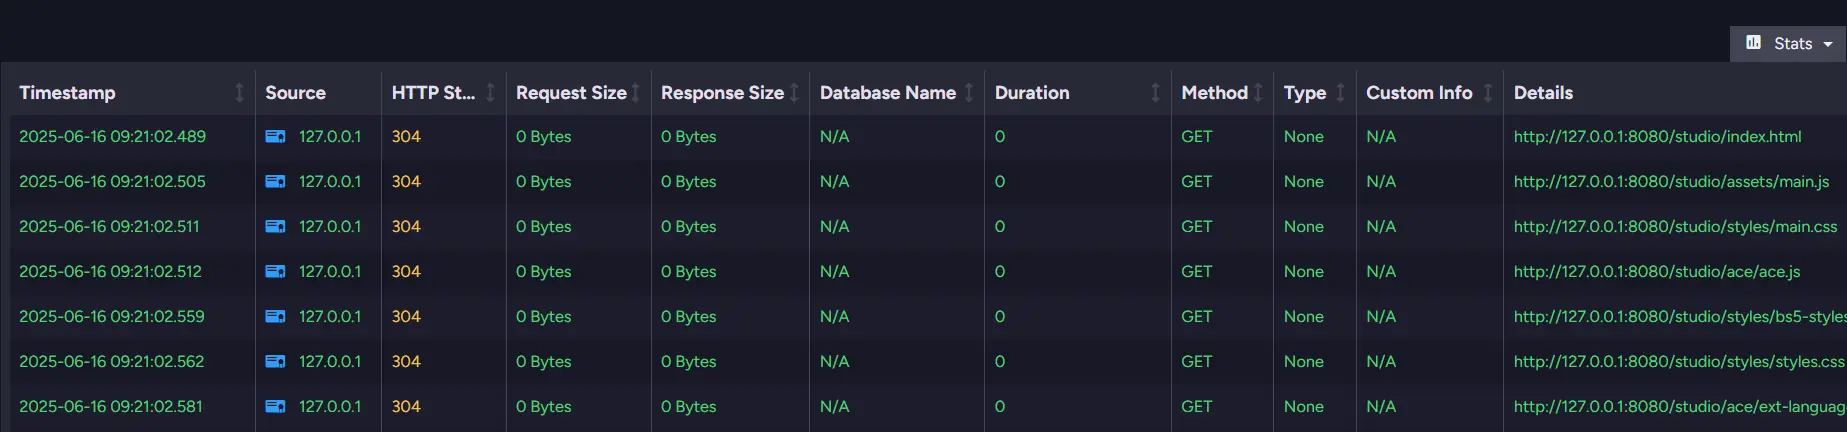
You can sort the data by columns such as Response Size or Duration. For example, if you suspect large messages block your processes, sort by request size. More detailed statistics are available in the 'Stats' section at the table's top right corner.
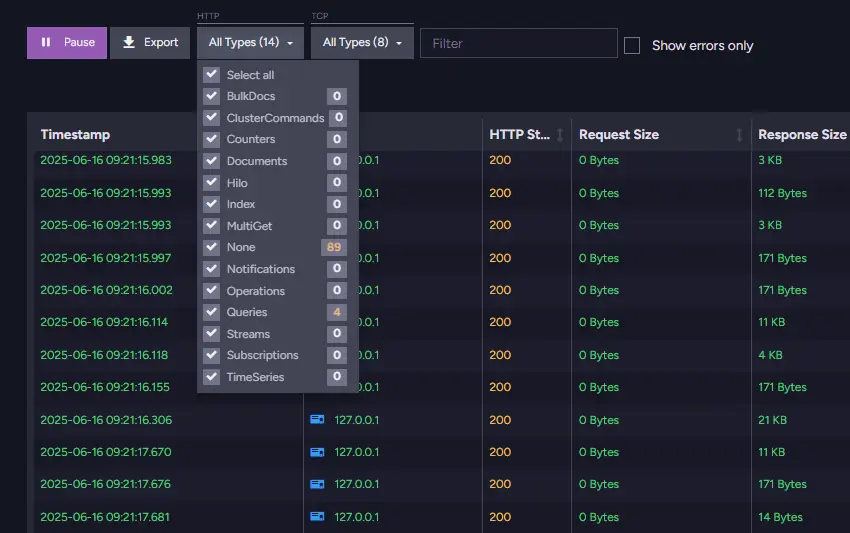
If you are checking for a specific type of connection, try using filtering - select the desired types from the foldable menu at the top of the page. You'll find multiple columns that provide various pieces of information.
A helpful detail is the row color. Warnings and errors have different colors - yellow for warnings and red for errors.
To share it with your team or RavenDB support, you can export it by clicking the Export button, allowing you to save it to a file.
You can view all current connections and their actions here; however, historical data is unavailable from this location. To set up the collection of historical data, please access the Admin Logs mentioned below.
Admin Logs
RavenDB 7.0+
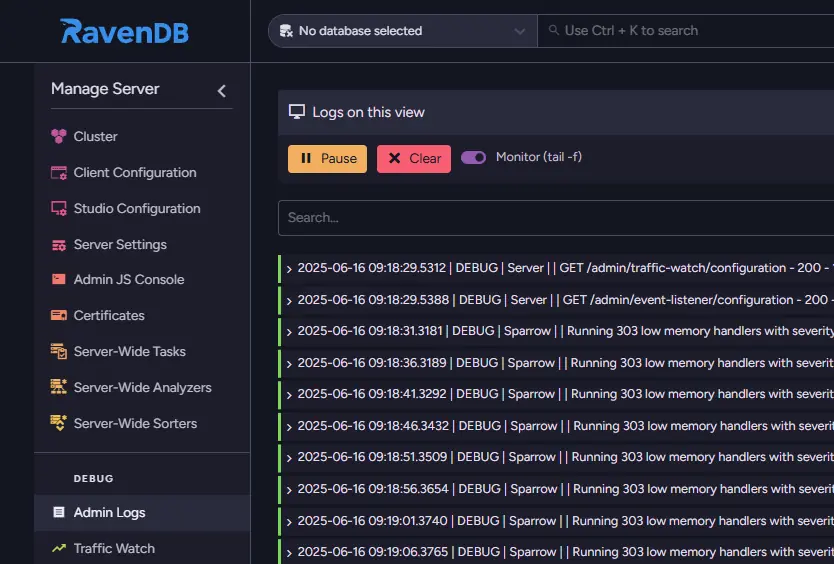
If you need to gather data for analysis, Admin Logs is the right place. You can access it just above Traffic Watch. Recently, we updated Admin Logs by integrating with NLog (changing logging levels and a few other functions), but they continue to function similarly to previous versions.
We recommend using Traffic Watch if you need active data. If you want to gather some debug data, and then download it once it's been set some time ago, we recommend Admin Logs.
You can filter this by writing conditions in 'Logs on this view' and selecting the level of logs that should be affected. If you want to read more about logging levels & how NLog works, take a look at the logs configuration docs.
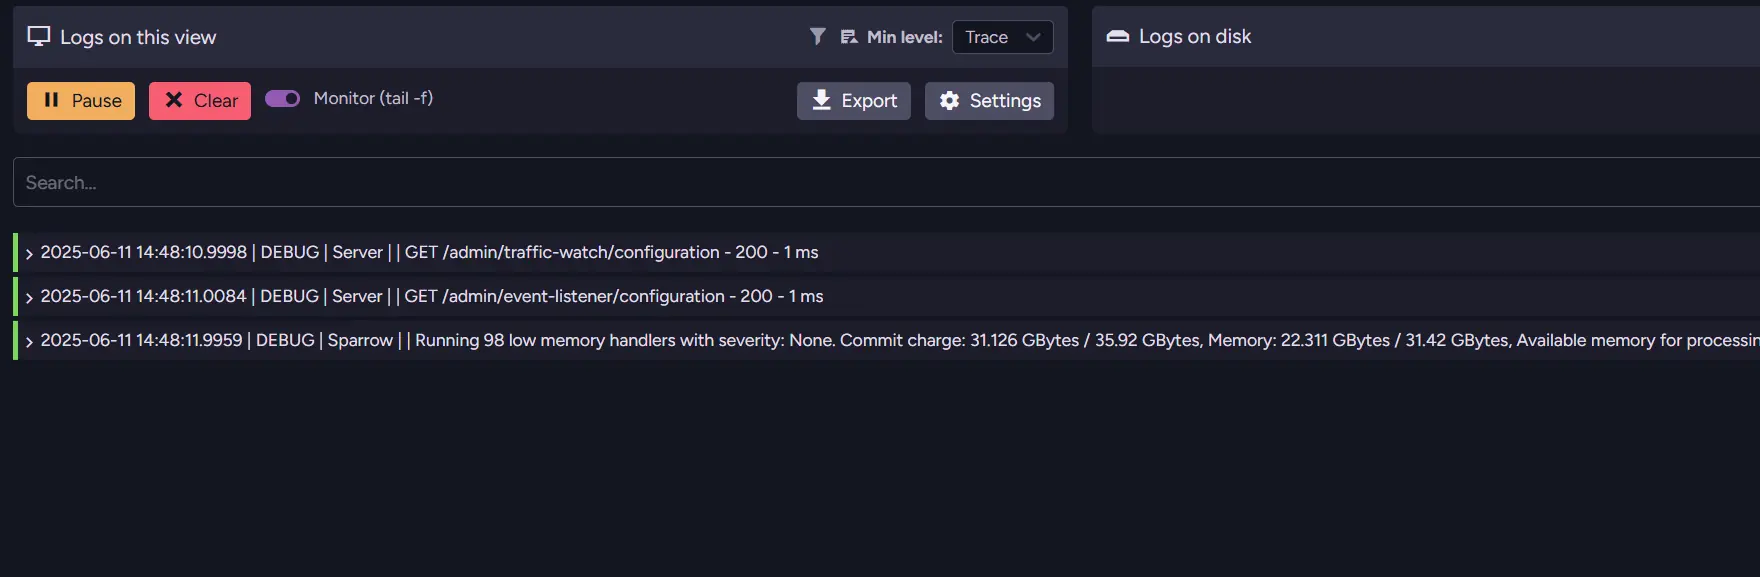
You can also enable various filter options in the Traffic Watch settings. Those live in the 'Logs on disc' section of this view, not in the Traffic Watch view itself. There are:
| Filter type | Example/Form |
|---|---|
| Types | Queries, Documents, Hilo |
| HTTP Status Codes | 101, 404 |
| Database | Database Names |
| HTTP Method | PUT, DELETE |
| Certificate Thumbnails | free.banana.client.certificate |
| Minimum Request Size | In bytes |
| Minimum Request Duration | In msec |
| Minimum Response Size | In bytes |
We use a filter to increase readability and performance. You can now watch closely and look for operations.
Digging for current information here can give you valuable information, but it is not the most efficient process. The best you can do is download and analyze logs after some time. This can also be used in late-night critical situations, such as when your database fails to respond at 2 AM. To do this, there is a 'Download' menu in 'Logs on disc' section. You can download the logs in a zip file, and multiple days can be downloaded at once, with each day's logs saved in a separate file.
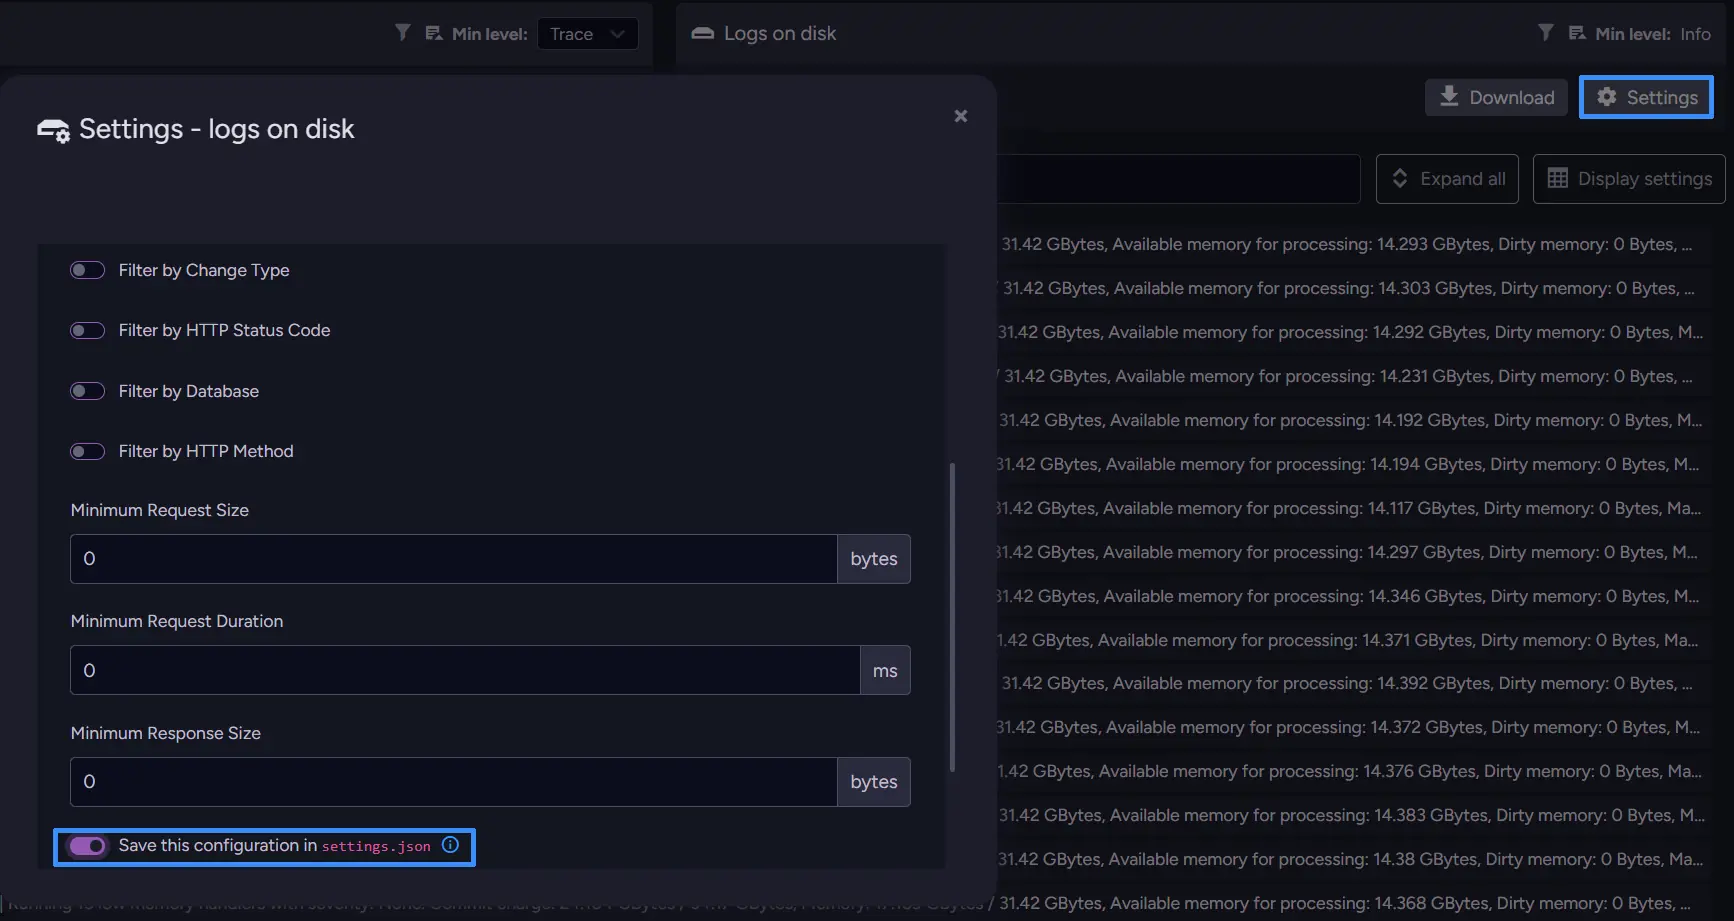
You can also enable Traffic Watch here, but please note that it may impact performance.
What should we be looking for? This depends on your needs. For instance, if you want to check that your application is functioning correctly, focus on your changes. Logs may look like this:
2025-03-18T10:38:43.5820686Z, 39, Operations, TrafficWatchManager, Raven.Server.RavenServerStartup, HTTP, Database, D9D8DC38174DA30700020B474BE19BCB48615380, request ID: 240, POST, 304, https://ravendb.cloud/databases/Database/queries?queryHash=12901611540662872339, https://ravendb.cloud, request size: 68 Bytes, response size: 0 Bytes, Queries, 4ms, custom info: from 'Movies'
Earlier versions
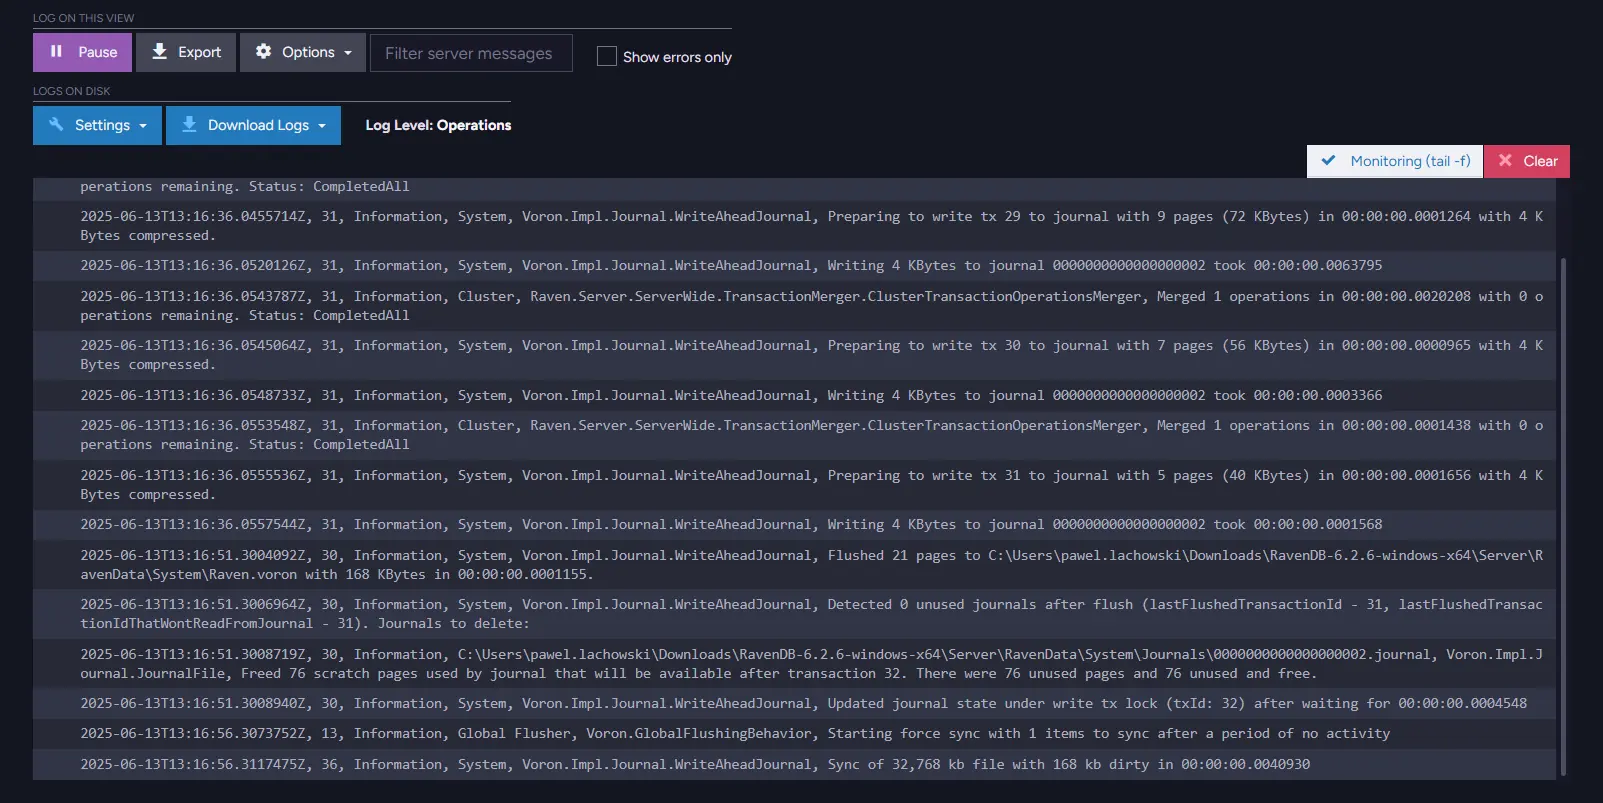
RavenDB 6.2
We didn't have NLog in earlier versions, so they looked different but functioned similarly. There are fewer log levels, and UI is grouped in one place, but this won't stop you from downloading the needed data.
Studio Notifications
We can also check the 'Notifications' menu in the studio's top-right corner. While not every event will trigger a notification, they can still provide valuable information. You can filter notifications by four severity levels: Success, Info, Warning, and Error. For example, index errors might be the underlying cause of optimization issues.
Audit Logs
If you need to know who accessed the database and what they did, you can do it with the Audit Logs feature.
These logs are more straightforward to analyze, but they contain less information. They primarily inform you about what happened with your database, when it occurred, and who was responsible, with a focus on security. You can easily check them by logging into your RavenDB Cloud Portal and selecting 'Manage' for your instance. On the right side, look for 'See audit logs', where you can choose a month and the logs you want to download. They are downloaded to your standard download folder.
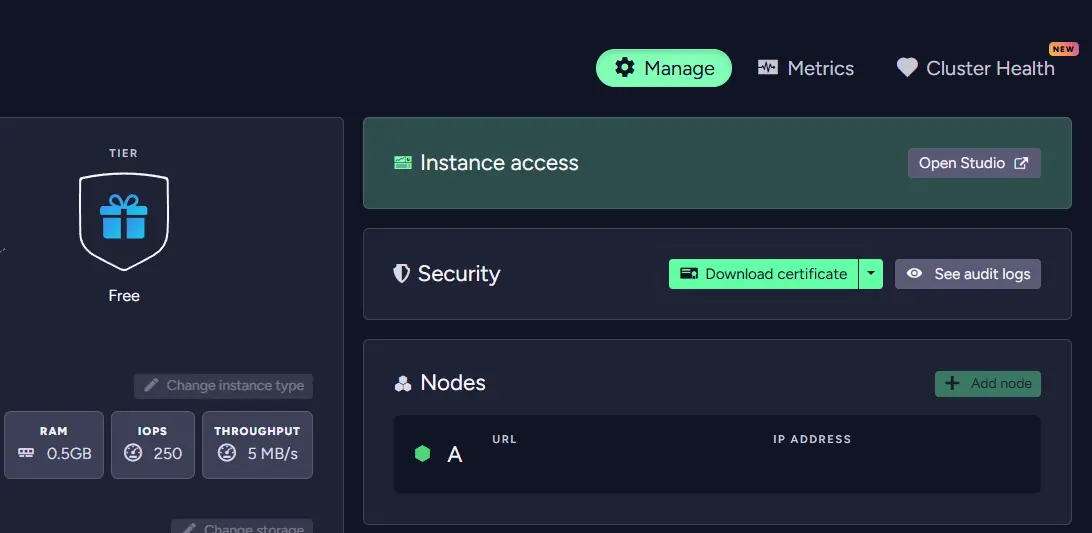
Simply unzip the file and open it with your preferred program. There, you can check if anything established a connection, deployed an index, or executed an export of a 2TB database on your RavenDB the moment problems began. This may help you find what is affecting your systems.
Summary
So, four places to look, and each one answers a different question. Traffic Watch tells you what is happening right now on the node you are connected to. Admin Logs tell you what happened earlier, as long as you set them up to collect beforehand. Studio Notifications surface the events the server itself thought were worth flagging. Audit Logs tell you who did it and when. If the problem is happening while you watch, start with Traffic Watch. If it already happened, go to Admin Logs.
After you have identified your problem, it is time to take action to fix it. If you would like to discuss it with experienced RavenDB developers, we would like to invite you to our community Discord server. We're chronically online there, as are our Community Champs. See you!
FAQs
How can I see the current, active connections hitting my database?
You can use the Traffic Watch feature, accessible from the 'Manage Server' menu, which allows you to monitor all active connections. You can also sort this data by metrics like response size or duration to see if large messages are blocking your processes.
What is the best tool for gathering and analyzing historical database activity?
For historical and debug data, you should use Admin Logs. Instead of active monitoring, Admin Logs allow you to download multiple days of log data at once in zip files. This is ideal for troubleshooting past events like a database failing to respond in the middle of the night.
Is there a way to track who accessed the system and what specific actions they performed?
Yes, the Audit Logs feature focuses on security by recording precisely who accessed the database, when it occurred, and what they did (such as deploying an index or executing an export). You can easily download these logs directly from the RavenDB Cloud Portal.