Which Index Ate My Disk?

What you’ll learn
- How to identify and troubleshoot disk issues caused by indexes in RavenDB.
- Practical tools and techniques for diagnosing disk usage issues.
- Using RavenDB tools to monitor index performance.
- Where to look for information to resolve disk problems related to indexing.
How to find the index eating your disk
To find the index eating your disk: run sudo iotop -a on Linux, or open Resource Monitor on Windows, and sort by disk write. Note the thread ID (TID) of the top Raven.Server thread whose command ends in [Idx <database>]. Then open RavenDB Studio, go to Manage Server > Advanced in the Debug section, and filter the thread list by that ID. Studio names the index that owns the thread. On Windows you can skip the lookup entirely, because Resource Monitor shows the index journal file path directly.
The rest of this guide walks through that procedure step by step, then covers what to do once you know which index is responsible.
Disk usage issues often stem from indexes consuming more resources than expected. Identifying and resolving these problems is crucial for maintaining optimal database performance. If your symptoms are broader than disk, the same diagnostic approach applies to high CPU usage and high memory usage.
Indexing Performance View
Let’s start by going through a tool that is available to every RavenDB user, which is the Indexing Performance view in Studio.
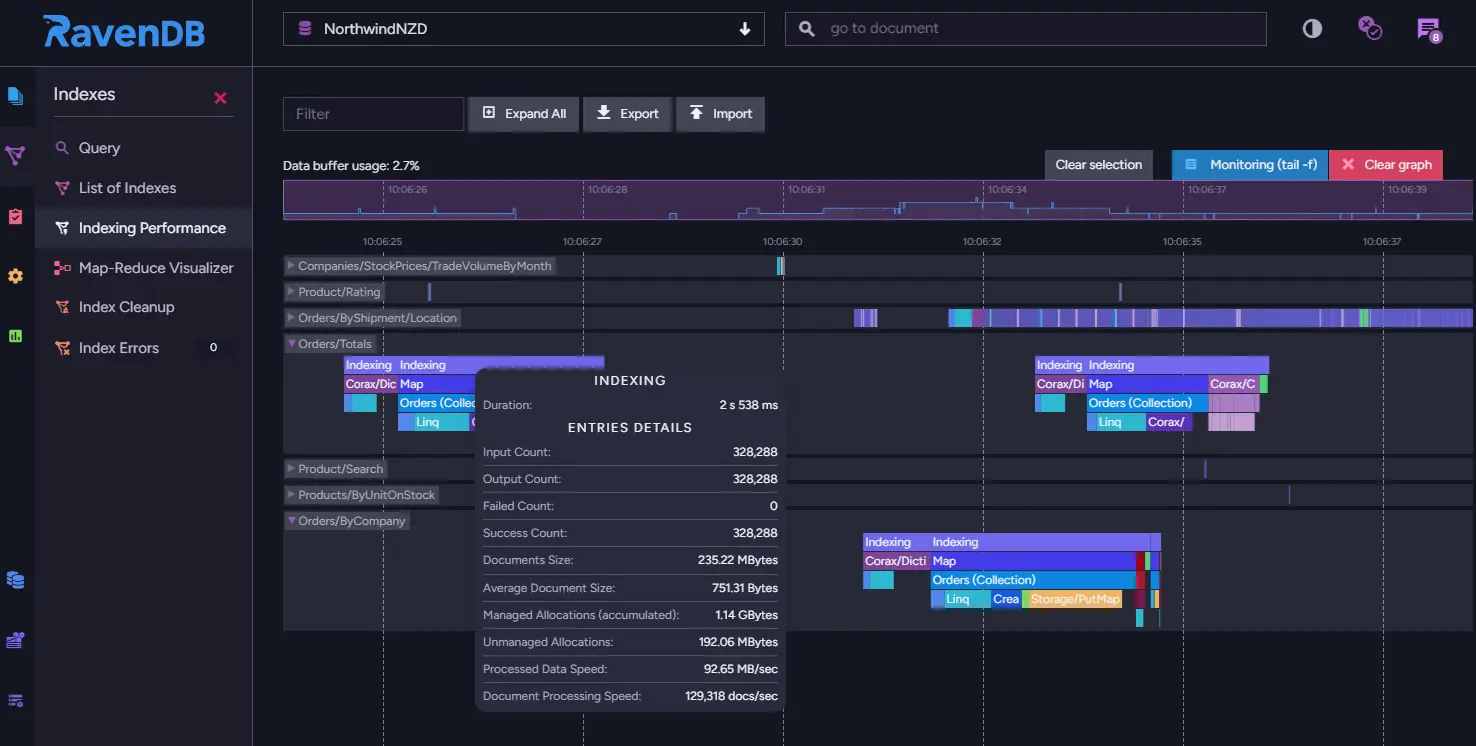
The Indexing Performance View in RavenDB Studio is a powerful tool that provides insights into how your indexes are performing. Understanding these metrics can help you identify and troubleshoot issues that may be consuming excessive disk resources.
Purpose of the Indexing Performance View
The Indexing Performance View allows you to monitor and analyze the behavior of your indexes. By providing real-time data on various performance metrics, this tool helps you pinpoint problematic indexes and optimize them for better performance and resource efficiency.
Key metrics
Indexing Time: This metric shows the total time taken by the index to process documents. Long indexing times can indicate complex computations or large data sets.
- Example: If an index is taking unusually long to process, it may be due to large fields or complex logic within the index definition.
Reduce Time: For map-reduce indexes, this metric shows the time taken for the reduce phase.
- Example: If the reduce time is high, it may indicate that the reduction logic is too complex or the data set is too large.
Indexing Throughput: This measures the number of documents indexed per second.
- Example: Low throughput could point to inefficiencies in the indexing process, potentially due to resource contention or suboptimal index definitions.
Interpreting metrics
To effectively use the Indexing Performance View, it's crucial to understand how to interpret these metrics:
- High Indexing Time: Indicates potential inefficiencies in index processing. Look for ways to simplify the index logic or reduce the amount of data being indexed.
- Long Reduce Time: May indicate complex reduction logic or large data sets. Simplify the reduction process where possible.
- Low Indexing Throughput: Could be a sign of resource contention or inefficiencies. Investigate server performance and optimize index definitions.
Example: A common mistake is to index large text fields or frequently changing fields which can lead to high resource consumption. By analyzing these metrics, you can identify such issues and take corrective actions. You can find more information about Indexing performance view in documentation.
Finding the index with iotop (Linux)
When your disk resources start to dwindle due to heavy indexing activity in RavenDB, identifying the specific index responsible is crucial. On Linux, the tool for the job is iotop, a disk I/O monitor. If you are on Windows, skip ahead to Finding the index with Resource Monitor (Windows), which gets you there in fewer steps.
Here’s a step-by-step guide to find which index is consuming the most resources:
- Install iotop If iotop is not already installed on your Linux machine, and you’re for example using Debian/Ubuntu you can use:
sudo apt-get install iotop
- Run iotop Launch iotop with root privileges and -a option to show accumulated I/O instead of bandwidth. In this mode, iotop shows the amount of I/O processes that have been done since iotop started:
sudo iotop -a
You’ll see something like this:
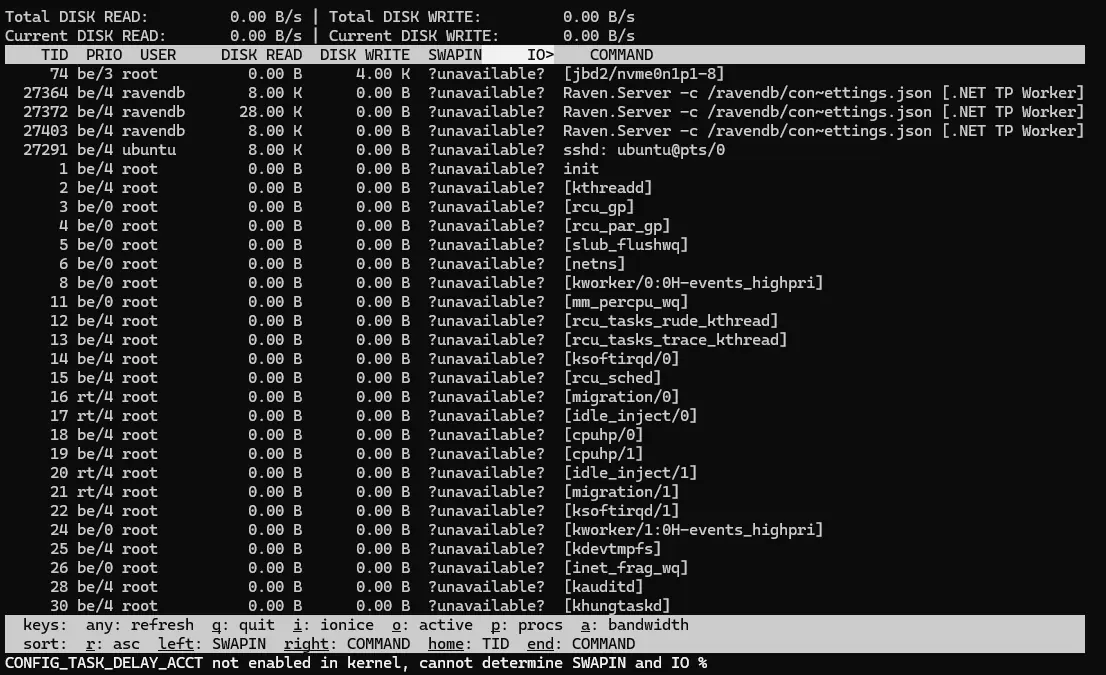
There’s a lot of information! But we’re mostly interested in columns:
- TID (Thread ID),
- DISK READ,
- DISK WRITE,
- COMMAND.
- Identify resource-intensive thread
In iotop you can sort values by each of the visible columns using arrows on the keyboard. For example I will sort by Disk Write:
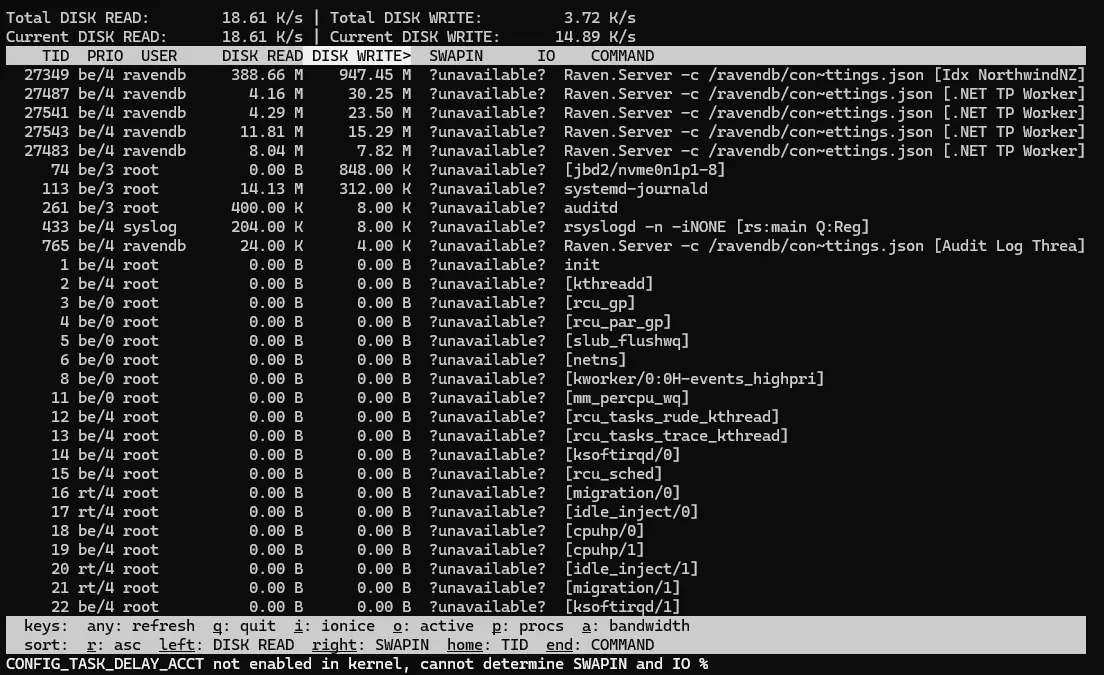
Now we can see in the first row the most write I/O intensive thread.
Raven.Server -c /ravendb/con~ttings.json [Idx NorthwindNZ]
That “Idx NorthwindNZ” at the end is a clear indicator that we’re dealing with an index thread, and the name after Idx is the database the index belongs to.
Note that the name is cut short. Linux caps a thread name at 15 characters, and Idx NorthwindNZ is exactly 15, so the database here is actually NorthwindNZD with the final D clipped off. Expect this on any database whose name pushes the thread label past the limit, and treat the value as a prefix rather than an exact match.
Let’s note the thread Id: 27349
- Go to RavenDB Studio Open RavenDB Studio in your browser and navigate to Manage Server and Advanced in the Debug section.
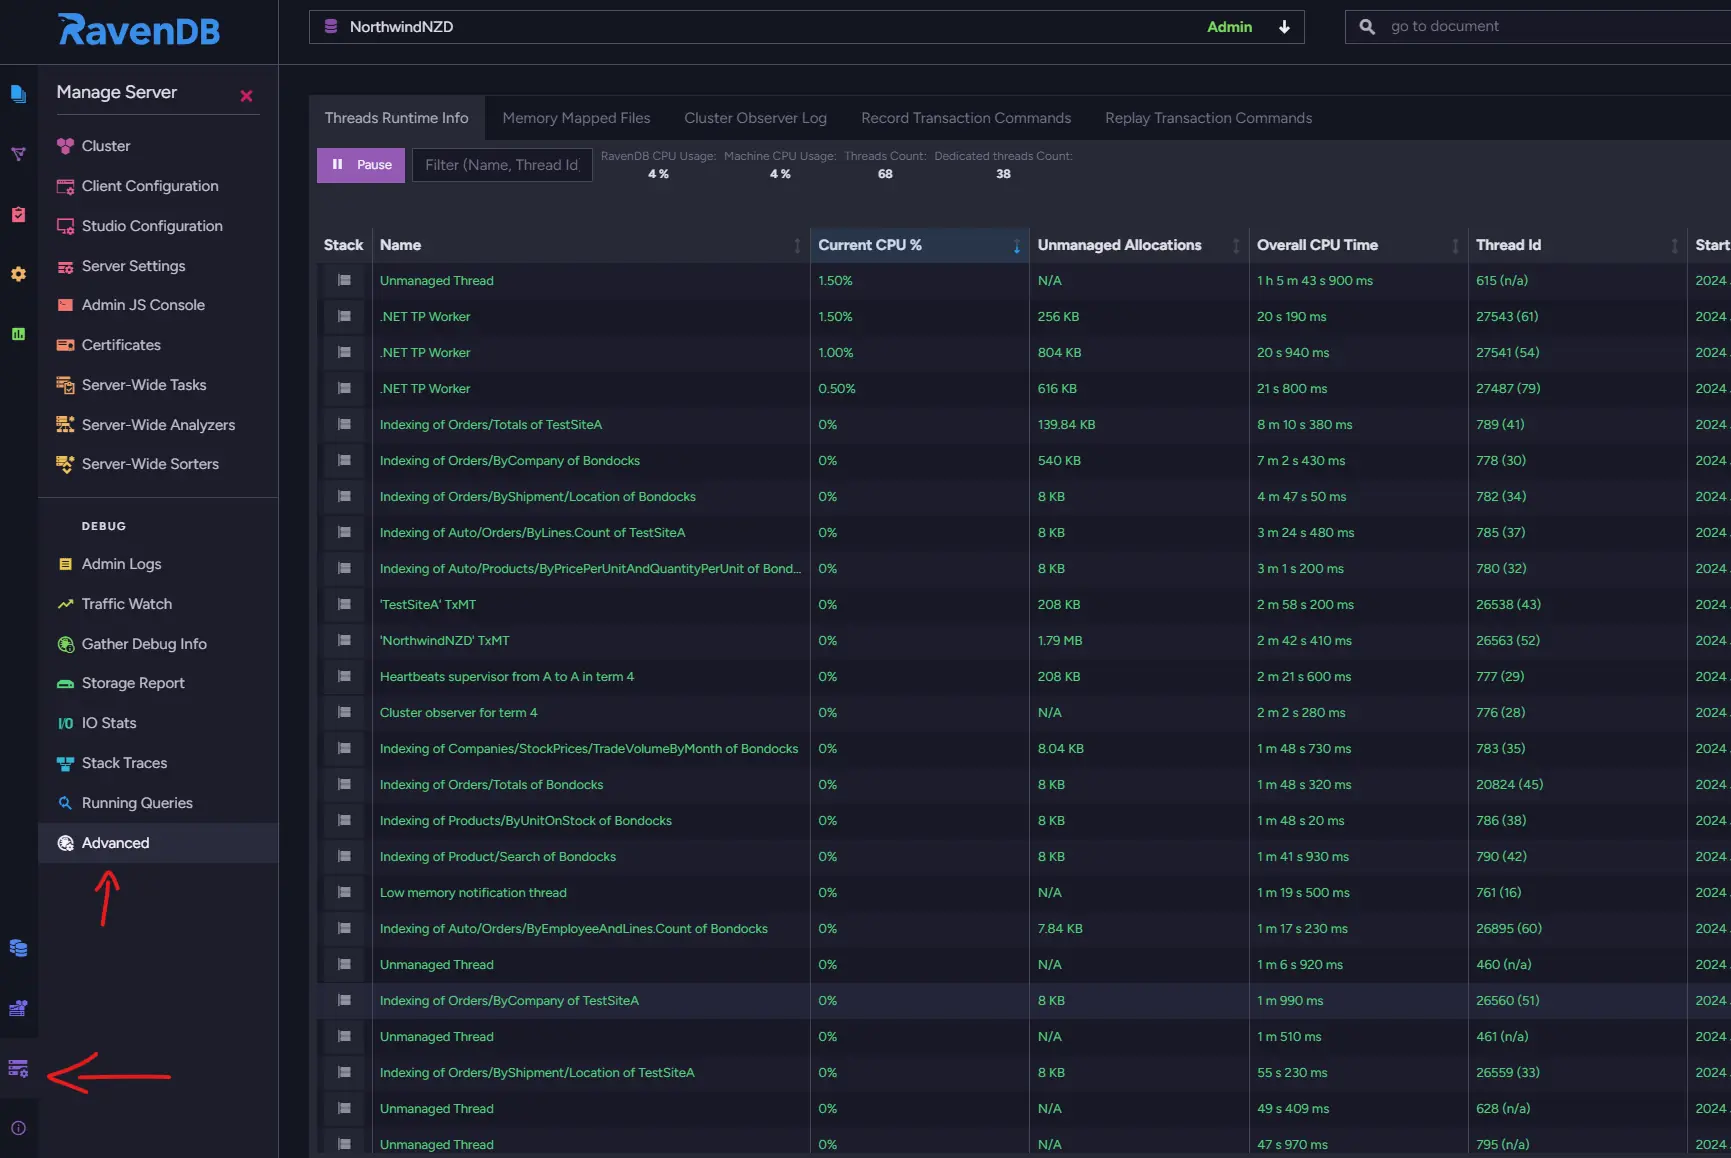
On this view you can filter threads by id which is perfect for us.
When I enter thread id from previous step I get exactly what I want:

Orders/ByShipment/Location which is a name of an index that is causing the most write I/O operations on my server.
Finding the index with Resource Monitor (Windows)
If you are running a RavenDB server on a Windows machine you should be able to access a tool like Resource Monitor. It is quite a handy tool. Using it you can cut straight to the chase since you can see the file path and finding the most I/O intensive index is just a matter of ordering by Read, Write or Total (B/sec):
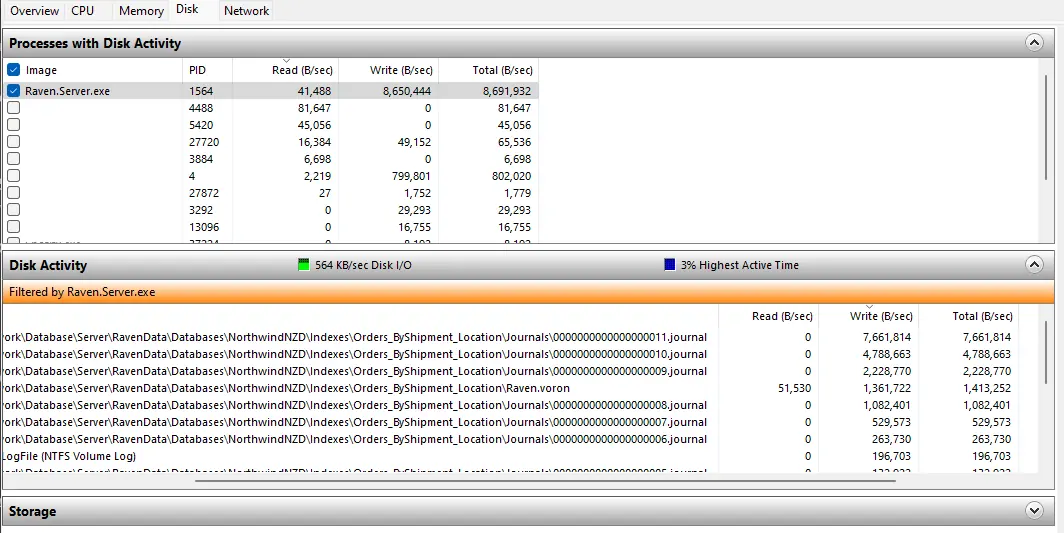
We can see that index Orders/ByShipment/Location is doing a lot of writing operations. Because the journal file path contains the index name, there is no thread ID to look up in Studio.
Index definition patterns that cost disk
Once you know which index is responsible, the next question is why. Most disk-hungry indexes fall into one of the patterns below. The table focuses on the disk cost of each pattern, which is what matters here. For the query-performance side of the same anti-patterns, with full code examples of the before and after, see Master RavenDB: Spotting red flags in index definitions.
| Pattern | Why it costs disk | Fix |
|---|---|---|
| Over-indexing | Every indexed field is written to the index, so indexing a large Biography field alongside LastName multiplies index size against no query benefit. | Index only fields that participate in queries. |
| Improper use of storing | Stored fields are written a second time, on top of being indexed. Storing a field you never project inflates the index for nothing. | Store only fields you retrieve from the index without loading the document. See Storing Data in Index and Master RavenDB: Projections performance. |
| Frequent updates | Small, constant re-index batches produce many journal writes and force frequent flushes, so write volume stays high even when little data changes. | Reduce update frequency where you can, then apply throttling and tune MapBatchSize. |
LoadDocument misuse | Creates a dependency on the referenced document. One Departments/1 update can re-index every Employee that references it, turning a single write into thousands. | Use LoadDocument only when necessary; denormalize the referenced values into the source document where practical. |
| Complex index definitions | Heavy computation extends indexing time and holds write batches open longer. | Simplify the logic and move computation out of the index where possible. |
| High cardinality fields | Every distinct value adds a term to the index, so unique-per-document fields grow the term dictionary without bound. | Avoid indexing high-cardinality fields unless a query needs them. |
| Indexing large arrays | Each array element becomes its own index entry, so a fanout index writes one document as hundreds of entries. | Limit indexing to the elements queries actually filter on. |
| Redundant indexes on one collection | Several narrow indexes over the same collection each process and store the same documents independently, so you pay the write cost repeatedly. | Merge them into one index. Studio's Index Merge view suggests candidates. |
If an index looks correct but still writes constantly, the problem may be staleness rather than the definition. See Master RavenDB: Indexing staleness.
For more information about these problems and how to fix them, see the documentation.
Analyze and optimize the index
Once we’ve identified the problematic index, whichever platform we found it on, the patterns table above covers the definition changes worth making and why each one reduces disk cost. Work through it against the index you just identified.
One lever the table does not cover is the choice of index type. If the culprit turns out to be an auto index that RavenDB created in response to a dynamic query, replacing it with a static index gives you explicit control over which fields are indexed and which are stored, so you can apply those fixes deliberately instead of leaving the shape of the index to the query optimizer.
Conclusions
We explored how to identify and troubleshoot disk usage issues caused by indexes in RavenDB, using iotop on Linux, Resource Monitor on Windows, and RavenDB Studio's Indexing Performance View. We also reviewed the index definition patterns that drive disk cost.
Best practices
- Simplify Index Definitions: Regularly review and optimize your indexes.
- Store Data in Indexes: Use this feature during projections for frequently queried but infrequently updated fields.
- Throttling: Implement throttling to balance the indexing load.
- Monitor Performance: Continuously monitor index performance using RavenDB tools.
Monitor and analyze regularly
Set up a monitoring system to keep track of key performance metrics. Regular analysis helps prevent unexpected spikes in resource usage and ensures efficient database performance. For a walkthrough of the health signals worth watching day to day, see How is my database today?.