Connecting Your AI Agent to RavenDB with MCP

An agent debugging your application can read every line of it. What it cannot do is look at your database. So it infers. It reads your entity classes, decides what the documents probably look like, writes a query from whatever it remembers about RQL, and when the answer comes back wrong it asks you to open the Studio and describe what you see.
That is the situation this guide is written for. The RavenDB MCP server closes the gap. It gives the agent twenty-one tools, each one labelled for what it answers. So when you ask, the agent already has something to check with and already knows which tool answers the question. The part where it works out how to approach the task at all does not happen: no hunting for the right endpoint, no reading up on how to authenticate against a secured cluster, no learning RQL by trial and error. Its turns go on your problem rather than on getting to it.
The MCP server looks after the parts you would otherwise have to watch. Every tool is read-only. Credentials are stripped out of configuration before it reaches the model. Results carry what the question needs rather than everything an endpoint happens to return, so the conversation does not fill up with payload nobody asked for. You set it up once and that holds for every session afterwards.
By the end of this guide the server is running in your own agent, and you have watched it work through three sessions where the difference shows: an endpoint that starts timing out, a configuration audit that must not leak credentials, and a cluster you have just inherited.
What is the MCP server?
The Model Context Protocol is how an agent talks to tools outside itself. The RavenDB MCP server is a small process that sits between your agent and one cluster, and exposes twenty-one tools for reading it.
| Area | Tools |
|---|---|
| Cluster and server | get_cluster_overview, get_server_config, get_server_resources, get_network_details, get_notifications |
| Databases | list_databases, get_database_record, get_database_stats, get_database_config |
| Indexes and queries | get_index, run_query |
| Documents and data | get_document_data, list_compare_exchange |
| Tasks and operations | get_tasks, get_live_workload, wait_for_completion |
| Storage | inspect_storage |
| Live diagnostics | sample_live_feed, export_server_logs, collect_debug_package |
| AI Agents | get_ai_agents |
Every one of them is read-only. Nothing creates, patches or deletes a document; nothing edits configuration, indexes or ongoing tasks; RQL that mutates is rejected before it reaches the cluster; and the whole surface is scoped to the certificate you hand it. An agent connected this way can answer questions about your cluster and cannot change it.
What changes once it is installed
This is not something you switch on for a task and off again. You install it once and your agent keeps the cluster in reach from then on, which changes what it does with a whole class of question. Anything that used to end with "can you check the Studio and tell me what it says" it now answers itself.
You notice it in four places.
- Day to day, while building. What does this document actually look like, does an index already cover this query, what is that task configured to do. These stop being questions the agent hands back to you.
- Debugging and troubleshooting. It checks the cluster's state instead of reasoning about it from the code, which is the difference between a theory and an answer.
- During an incident. The same thing under time pressure. Whatever the agent spends looking is small next to what the outage costs while nobody knows the cause yet.
- When someone asks whether an agent can touch production. Read-only by construction, secrets redacted before they reach the model, and per-tool approval in the client, so the answer can be yes.
The rest of the time it sits there. Ask about your code and nothing reaches for the cluster; ask something the cluster knows and the answer comes from the cluster. You are not choosing between those, the agent is, and it now has both.
What has to exist first
A running cluster the agent can reach, and its URL. If the cluster is secured you also need a
client certificate as a .pfx, and
its password if it has one. The MCP server holds no state of its own and stores nothing between
runs.
npx runs a self-contained build that wants libicu on the machine, which on a minimal Linux image
is the one thing you have to add. dnx takes it from the .NET SDK you already have, and the
marketplace install carries its own.
Installing it
Two ways in. Pick whichever matches your client.
Claude Desktop
Available in the official connectors directory.
Open your connector settings, search for RavenDB, and enable it. Fill in the cluster URL when prompted.
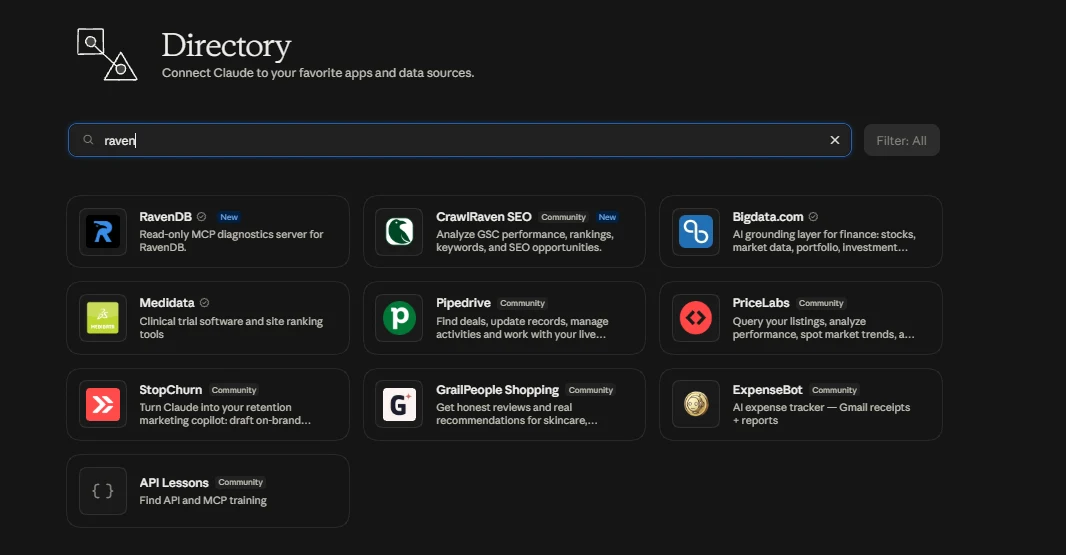
The entry is verified. The settings page afterwards:
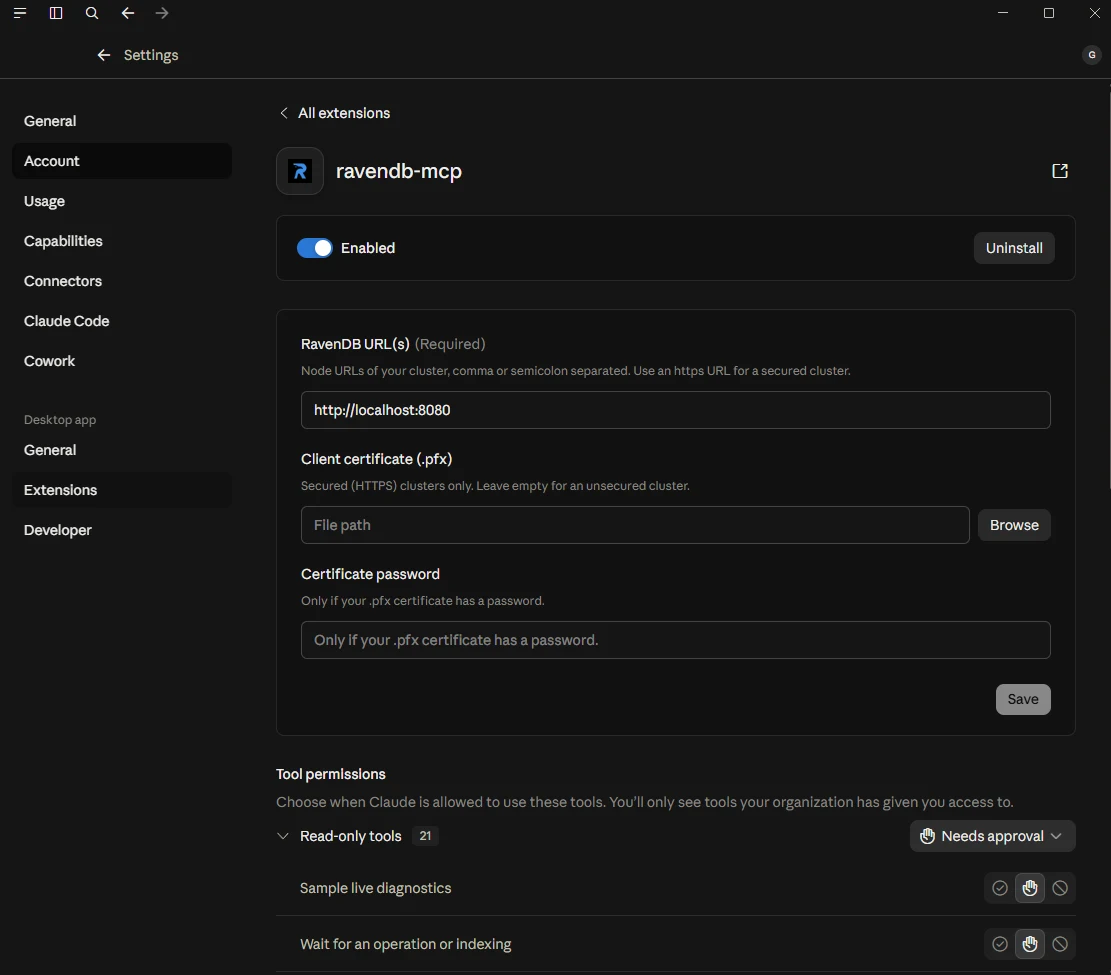
Twenty-one tools, the whole catalogue, and the client itself labels them read-only. Each one can be set to run freely, ask first, or never run at all, so you can hand the agent the cluster and still keep the live diagnostics behind a prompt.
For a secured cluster the same page takes the certificate: give the URL an https scheme, point
Client certificate at your .pfx, and add the password only if it has one.
Write it into a config file
Every other client reads the same shape from a file, and several give you a shortcut so you never open one.
Claude Code takes it as a command:
claude mcp add ravendb --scope user --env RAVENDB_URLS=http://localhost:8080 -- npx -y @ravendb/mcp
or as a plugin, which asks for the cluster URL during setup:
/plugin marketplace add ravendb/ravendb-mcp
/plugin install ravendb-mcp@ravendb
Cursor takes a one-click install link that fills the whole entry in for you, or
.cursor/mcp.json if you would rather see what it wrote.
VS Code reads .vscode/mcp.json for a workspace. Visual Studio reads the same shape from its own
location, which its documentation below gives:
{
  "servers": {
    "ravendb": {
      "command": "npx",
      "args": ["-y", "@ravendb/mcp"],
      "env": { "RAVENDB_URLS": "http://localhost:8080" }
    }
  }
}
Codex reads the same thing as TOML in ~/.codex/config.toml:
[mcp_servers.ravendb]
command = "npx"
args = ["-y", "@ravendb/mcp"]
env = { RAVENDB_URLS = "http://localhost:8080" }
All of these point at http://localhost:8080. Change it to wherever your cluster is.
For a secured cluster the certificate sits beside the URL:
"env": {
  "RAVENDB_URLS": "https://a.example.com:443",
  "RAVENDB_CERTIFICATE_PATH": "/path/to/client.pfx",
  "RAVENDB_CERTIFICATE_PASSWORD": "…"
}
The certificate decides what the agent can see, so one scoped to a single database gives you an agent
scoped to a single database. RAVENDB_URLS also takes several nodes of the same cluster, comma or semicolon separated; for a
second cluster, run a second instance.
If the machine has the .NET SDK but no Node, swap npx -y @ravendb/mcp for dnx RavenDB.Mcp --yes
and change nothing else.
Checking the wiring
Ask the agent to list the databases. It is the cheapest call in the catalogue and it exercises the whole path: the client launches the process, the process loads the certificate, the cluster answers.
List the databases on my RavenDB cluster.
* ravendb - list_databases()
  -> {"databases": ["reports", "warehouse", "billing"]}

Three databases: reports, warehouse and billing.
The tool call is the part that matters. If you see one, the server is running and the cluster answered. Two ways it goes wrong, and they look nothing alike.
No tool call at all, and the agent says it has no way to reach RavenDB. The client never started the server, so the problem is the configuration rather than the cluster. Check the file you edited, and that the client was restarted afterwards.
A tool call that comes back with an error. The server started; the cluster did not answer.
* ravendb - list_databases()
  -> Error: No connection could be made because the target machine actively
     refused it. (localhost:8080)
Work outwards from there: is the URL right, is the cluster up, and on an https URL does the
certificate belong to that cluster. A certificate the cluster does not recognise fails during the
handshake, so the message mentions TLS rather than a refused connection.
Demo
Setup is done. Let's see how it works in practice, across three scenarios we ran against a live cluster.
An endpoint that started timing out
Here is the situation as it usually arrives. A reports endpoint that was fine for months is timing out, and nothing in that code path changed.
The endpoint's own query looks guilty. No page size, a client-side SelectMany and GroupBy over
everything it pulled back. And here is what makes this case worth walking through: it is slow.
An agent that reads the code, finds that loop and reports it has told you something true and
useless, because optimising the loop is not the fix. Not running it is.
You hand it over the way you would hand it to a colleague:
/reports/top-productsstarted timing out this morning and nothing in that code path changed. Find out why.
You do not tell it which tools to use. The path below is the shape it takes; the numbers are from the measured scenario this guide was written against.
It starts with the size of the problem, because "slow" and "slow at this volume" are different bugs:
* ravendb - get_database_stats(databaseName: "reports")
  -> Orders: 612,480 documents

The report aggregates in memory over every matching order. At this collection
size that is 271,028 documents per request. Checking what indexes exist before
assuming it has to be done that way.
That last sentence is the move a reader cannot make from the source, and it is the whole point.
Asking the cluster what indexes exist turns up OrdersByProductDaily, a
map-reduce index that already computes precisely this rollup,
reducing to 10,686 entries and answering in 18 milliseconds against 11.2 seconds for the
in-memory aggregation.
Nothing in the reporting code references it. It lives in the analytics feature's folder, written by someone else for something else. To know it is there you either read the whole repository or you ask the MCP server what it has.
The agent also has room to be careful rather than lucky, and this is where reading the cluster beats
guessing twice over. The index reduces by product and day, so "top products since X" still has
to sum across days: it is not a drop-in replacement. And it fans out over order lines, which around
8% of orders do not have. Those legacy orders contribute nothing to product totals either way, so
the answers do match, but an agent that swaps the query without checking has gotten away with it
rather than verified it. Both facts are one get_index call away and invisible from the code.
The endpoint was also getting worse on its own: the same report measured 5.8 seconds at 150,000 orders and 11.2 once load testing pushed the collection past 600,000. That trend is a property of the data, not of the code, which is why nothing in the code path had to change for this morning to be the morning it broke.
Why the agent stopped inventing RQL
The reason agents write bad RQL is not that RQL is hard. It is that three of its rules cascade, and
an agent working from memory of SQL trips all three: clause order is fixed, dynamic group by
allows only count() and sum(), and facet() needs a static index.
The server publishes those rules as resources under rql://, so the agent can read them instead of
recalling them.
That is measurable, so we measured it: the same model against the same seeded cluster, eleven runs per arm, one arm with the MCP server and one with only a shell, transcripts counted by script. Across every scenario, queries written through the server were rejected by the parser zero times in 176 attempts. Without it, 34 of 73 were rejected.
That is not an artifact of asking fewer questions: the agent with the MCP server queried the database roughly two and a half times more often. It asked more and got it right every time.
What that looks like in a session is one wrong turn and no second one:
* ravendb - run_query(databaseName: "reports", query: "from Orders ...")
  -> Error: InvalidQueryException. Unexpected token.

* ReadMcpResource(rql://cheatsheet)
  -> clause order, dynamic group by limits, which features need a static index

* ravendb - run_query(databaseName: "reports", query: "from Orders ...")
  -> {"results": [...], "totalResults": 1284}
The agent does not guess twice. It goes and reads what the server publishes, and every query after that point parses.
A configuration audit that must not leak credentials
Ask an agent what a database's backup and ETL tasks connect to, and you have asked it to read connection strings. Those hold access keys.
Through the server, the answer to that question looks like this:
{
  "BucketName": "billing-archive-prod",
  "RemoteFolderName": "orders",
  "AwsRegionName": "eu-central-1",
  "AwsAccessKey": "***redacted***",
  "AwsSecretKey": "***redacted***"
}
The audit still completes. The agent can tell you the bucket, the region, the folder, and which task uses the connection, which is everything the question actually needed. What it cannot tell you, and cannot leak into a transcript, a log or a model's context, is the key.
Run the same audit through a shell against the same endpoint and both keys arrive in full, and stay there for the rest of the conversation.
Secrets are redacted out of configuration the tools return. Log exports, admin-log and traffic-watch samples, and debug packages are not scrubbed: they are the raw material and are handed to you as files. Treat them the way you would treat the files themselves.
A cluster you just inherited
The shortest useful tour is three questions.
list_databases and get_cluster_overview tell you what exists and what shape the cluster is in:
nodes, leader, versions, health.
get_database_record per database is the "what is configured here" question. It carries topology,
ongoing tasks, and feature settings in one answer, with index definitions reduced to names and
counts so it stays readable.
get_notifications is the "what is already wrong" question, and on an inherited cluster it is
frequently the most interesting answer of the three.
Asked plainly, the answer comes back shaped like this:
I just inherited this cluster. Give me the tour: what is here, what is configured, and what is already broken.
* ravendb - list_databases()
* ravendb - get_cluster_overview(include: ["Nodes", "ServerInfo"])
* ravendb - get_notifications()

Three databases on a single node running 7.2. Two things worth knowing before
anything else:

- billing has an ETL task to SQL that has been disabled for 34 days. Nobody
  turned it back on.
- warehouse keeps revisions with no purge limit and its storage is at 81% of
  the volume.

Nothing is actively failing. Want me to dig into either of those?
Three calls, and whatever is worth knowing about your cluster is on screen before you have opened the Studio. The findings above are an illustration; what you get back is whatever your cluster actually has. From there you follow whatever came back, which is the point: the agent is working from the cluster's state rather than from your description of it.
One thing to know before you rely on it
An agent that can see the cluster is more thorough than one that cannot, and thoroughness shows up on the bill. Here is where that shows up.
The cost of a session is the conversation re-read on every turn, so it comes to roughly the context carried multiplied by the turns taken. An agent with the MCP server asks more questions and gets a complete answer to each one, so both factors go up. On the longest session we ran, twenty-two tasks against one cluster, it issued 48 successful queries where the same agent without the server attempted 36 and had about half of them rejected by the parser. The extra spend buys answers that are actually answers.
That makes it a straightforward call. Where a wrong answer is expensive, and it usually is during an incident, a migration, or the first week on a cluster nobody has read yet, the extra questions are the cheapest part of the day. Where your agent already has what it needs in the code, it will not reach for the cluster in the first place.
The server keeps its own side lean. Tool results carry what a caller needs rather than everything the endpoint happens to return. From 1.1.0 a settings lookup costs a fraction of what it did, and a few seconds of live traffic comes back folded by request shape rather than one entry per event.
What it will not do
- It never writes. No document is created, patched or deleted, and mutating RQL is rejected. Your client shows you the same thing: twenty-one tools, all read-only, each one individually approvable.
- One cluster per instance.
RAVENDB_URLStakes several nodes of one cluster. Point a second instance at a second cluster. - Log exports and debug packages are not scrubbed. See the note above.
- It does not replace the Studio. It answers questions. It administers nothing.
Cheatsheet
What to ask, and which tool answers it
You ask in your own words. The right-hand column names the tool the agent should reach for, so you can check the call it made against the answer it gave.
| If you want to know | Ask for it like this | Tool it reaches for |
|---|---|---|
| whether anything is wrong at all | "Is anything wrong with this cluster right now?" | get_notifications |
| why something got slow this morning | "This endpoint started timing out. Find out why." | get_database_stats, then get_index |
| what is loading the server right now | "What is hitting the cluster at the moment?" | get_live_workload |
| whether a task is keeping up | "Is the nightly backup still on schedule?" | get_tasks |
| what an unfamiliar cluster holds | "What is in this cluster, and what is configured?" | list_databases, get_cluster_overview |
| what a connection string points at | "What does the archive task connect to?" | get_database_record, credentials redacted |
| what the data actually looks like | "Show me a few orders from last week." | run_query, paged and projected |
What it no longer gets wrong
RQL is not SQL, and the differences are the kind an agent working from memory gets wrong confidently: which clauses may appear together, which aggregations a dynamic query supports, and which features need a static index behind them. The server publishes the rules as resources, so the agent reads them rather than recalling them, and the syntax itself stays where it belongs, on What is RQL.
Summary
Connecting an agent to a live cluster came down to one environment variable, plus a certificate if the cluster is secured. What changes afterwards:
- The agent reads cluster state instead of inferring it, so index staleness, task lag and live load become things it checks rather than things it asks you about.
- It writes RQL against the published rules rather than from memory.
- Credentials in configuration stay out of the model's context, and the audit still completes.
- Nothing it can do changes your data.