RavenDB Data Visualization with Power BI

What you will learn
- How to enable the PostgreSQL protocol on your RavenDB server
- How to create the credentials Power BI authenticates with
- How to load your RavenDB collections into Power BI
- How to build a chart from your documents
- How to filter your data with a query at import time
- When to pick Import over DirectQuery, and how incremental refresh behaves
Introduction
Sometimes, data is easier to present in bars, columns, or other graphs. For those situations, Microsoft's Power BI data visualization software is perfect. This article will focus on transferring our data into the Power BI desktop application, creating charts, and even importing queries.
As of RavenDB 7.2, the PostgreSQL protocol is included in every license, but connecting Power BI to RavenDB requires a license that explicitly enables Power BI support. Studio's About page lists what your license includes, and the licensing overview covers how to check and change it.
Prerequisites
Before you start, make sure you have:
- A RavenDB server you can edit
settings.jsonon and restart. - A license that enables Power BI support. The PostgreSQL protocol itself is included in every license, but Power BI access is licensed separately. Check Studio's About page to see what your license covers, or get a license that includes it.
- The Power BI desktop application.
- A database with the Northwind sample data loaded, which is what the examples below use.
- Port 5433 reachable from the machine running Power BI, or whichever port you configure instead.
Two limits are worth knowing up front. The PostgreSQL protocol is not supported on sharded databases, and it does not run on 32-bit platforms, so the Raspberry Pi and Windows x86 packages cannot serve it even with the setting enabled.
Enable the PostgreSQL protocol in RavenDB
RavenDB can expose a PostgreSQL protocol endpoint, and Power BI ships with a native PostgreSQL connector. That is the whole trick. RavenDB speaks PostgreSQL, Power BI thinks it is talking to a PostgreSQL database, and your documents land in your report.
Turn on PostgreSQL support in settings.json
To begin, we need to turn that endpoint on. Open the settings.json file in your RavenDB directory and paste the following to enable PostgreSQL support:
"Integrations.PostgreSQL.Enabled": true,
"Features.Availability": "Experimental"
PostgreSQL support is an experimental feature, so both keys are needed. Restart the server after saving for them to take effect.
The screenshot below shows the enable key sitting in the file, so you can see where the change belongs. Add the availability key alongside it.
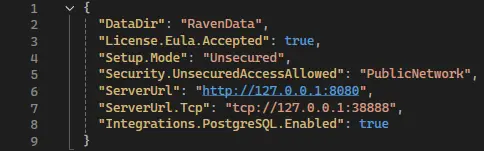
These are the settings involved:
| Setting | Default | What it does |
|---|---|---|
Integrations.PostgreSQL.Enabled | false | Turns the PostgreSQL endpoint on. |
Features.Availability | Stable | Must be Experimental, because PostgreSQL support is an experimental feature. |
Integrations.PostgreSQL.Port | 5433 | The port PostgreSQL clients, Power BI included, connect on. |
All three are server-wide and read at startup, so a restart is needed after changing any of them. If 5433 clashes with something else on the machine, set Integrations.PostgreSQL.Port to a free port in the same file and use that port everywhere below.
Add integration credentials in the Studio
After saving your config file, open your RavenDB studio. In your selected database(1), choose 'Settings'(2) and 'Integrations'(3). Inside, you want to add new credentials. You can do that by pressing the blue 'Add new' button(4). Select the username and password used for Power BI. You can also generate your password. Remember to store it safely.
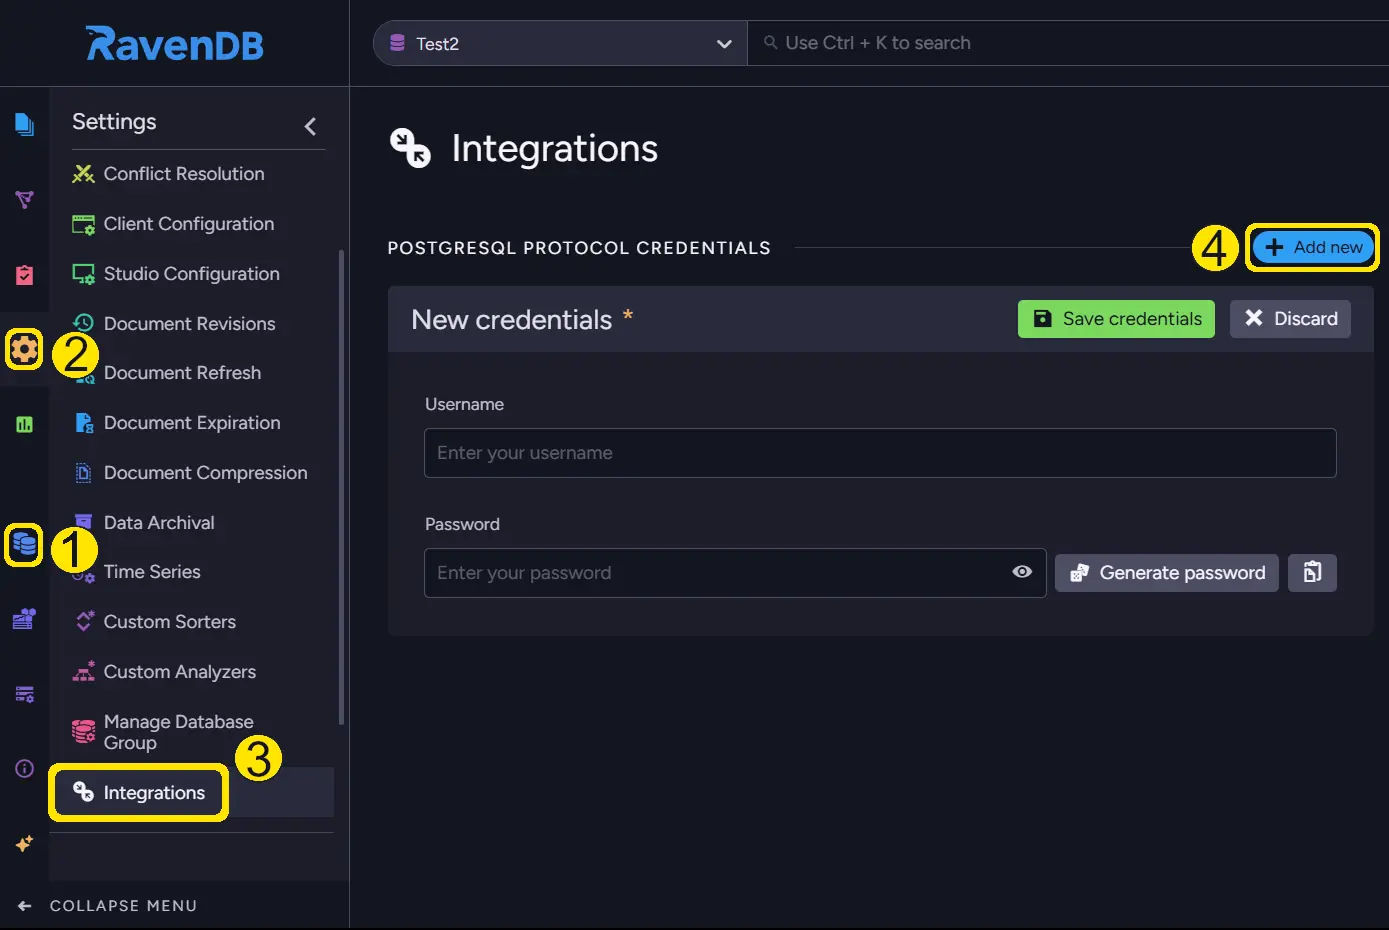
We've successfully started impersonating PostgreSQL and gathered credentials. Those will allow us to connect to RavenDB disguised as PostgreSQL. Now, let's configure the Power BI side.
Connect Power BI to RavenDB
Create the connection
Launch your Power BI and begin transporting your data. Create a new blank report, click on 'Get data from another source', and search for the PostgreSQL database option. The Power BI documentation page covers the same connection flow if you want the reference version alongside this walkthrough.

Now, you need to fill in the required data. First is your server address, which you can quickly get from the URL. Remember to grab your address and delete the "https://" prefix and other studio-related info. You must also include a port set by RavenDB specifically for PostgreSQL protocol communication to 5433 by default.
Right below it, you need to add the database name for which you enabled integration. Now, you can click OK and proceed. You need to provide the credentials you created during the configuration of RavenDB at the start of this article.

Select collections and load your data
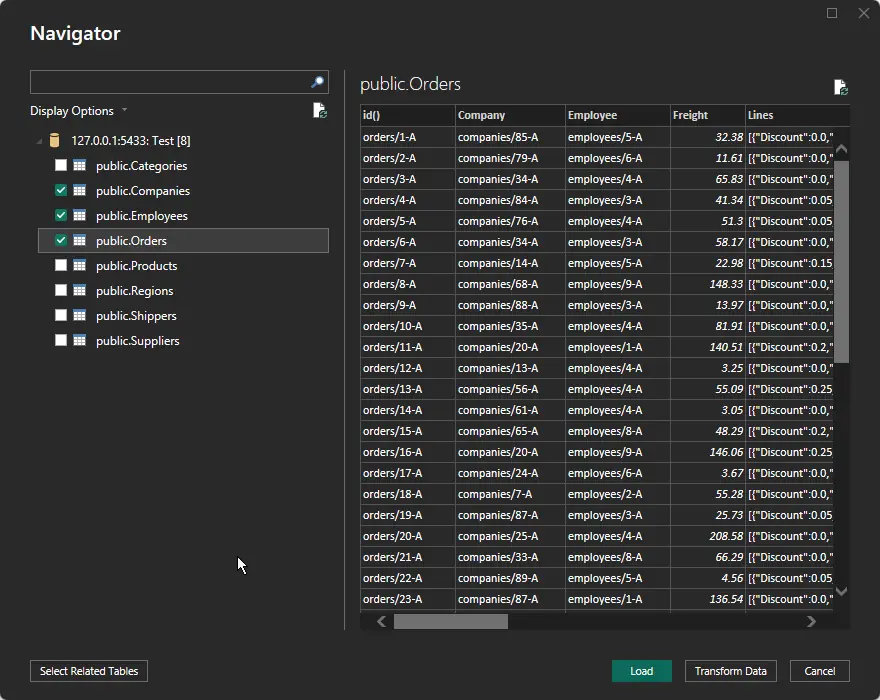
When you provide your credentials, you will be directed to a menu where you can select which collections you want to include in this report. We suggest selecting orders, companies, and employees to test if everything works. After selecting your data from the list, press load in the bottom right corner of this window.
Build your first chart
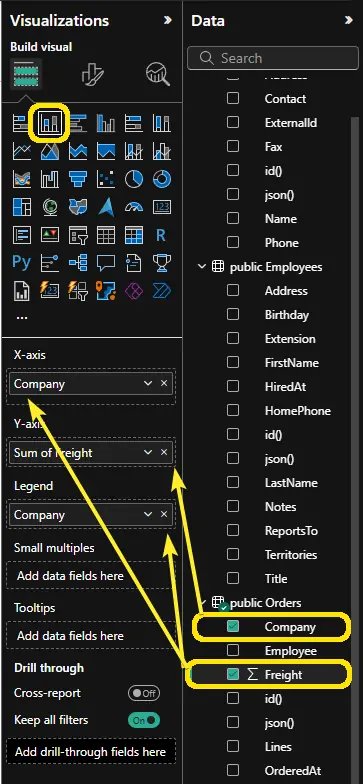
After loading your data, you can choose the visualization you want on the right and which data you want to display in the selected form. For example, you could create a stacked column chart and add 'Company' (into the x-axis) and 'Freight' (y-axis) from 'public Orders'. Then, on the top left, change the 'Freight' data type to Decimal numbers. You can add 'Company' to the Legend slot to make columns have different colors.
Filter your data with a query at import time
Those create basic visualizations for this data, but you should take a step further. Open a new page or blank report and start importing data by opening a new blank report or clicking get data in the top left corner. After filling out your server and database, click 'Advanced options' at the bottom of the current window. There, we can do much more than just import data. Let's say you want to import data that is sent to London. Using a query, we can filter the data we want. The query that would do the following would look like this:
from "Orders"
where ShipTo.City = 'London'
Then, continue as before. When your data has loaded, build the chart the same way you did earlier: 'Company' on the x-axis and 'Freight' on the y-axis, this time taken from the query results instead of the full 'public Orders' table. You will get a column graph covering only orders shipped to London. Filtering at import time keeps the report small and pushes the work down into RavenDB, instead of loading every document and slicing it in Power BI.
FAQ
Do I have to restart the server after editing settings.json?
Yes. Both Integrations.PostgreSQL.Enabled and Features.Availability are read at startup, so the PostgreSQL endpoint only appears after a restart. If you set up your server with the setup wizard and turned on its Experimental features option, both keys are already in your settings.json.
Should I pick Import or DirectQuery?
Both modes work against RavenDB, and you choose between them in the same dialog where you enter the server and database.
| Import | DirectQuery | |
|---|---|---|
| Where the data lives | Copied into Power BI's in-memory model | No local copy, RavenDB is queried each time |
| Freshness | Shows RavenDB changes only after a refresh | Live |
| Report responsiveness | Fast, everything is already in memory | Depends on the query behind each interaction |
| Dataset size | Has to fit in memory | No need to fit in memory |
| Incremental refresh | Supported | Not applicable |
| Pick it for | A stable snapshot, like a monthly sales summary | Live dashboards, or data too large to load |
Can I write SQL instead of RQL?
Yes. RavenDB detects the query language automatically, so you can put either one in the SQL statement box. SQL SELECT queries get translated to RQL and run on the database. One thing to watch: do not end the query with a semicolon. Power BI wraps your query inside a larger one, where a trailing ; is a syntax error.
Where do the extra id and json columns come from?
RavenDB adds them. id holds each document's ID, and json holds any document properties that did not fit the regular columns. Older RavenDB versions exposed these as id() and json(), and the server still recognizes those names, so existing reports keep working.
Does Power BI incremental refresh work with RavenDB?
Yes, and it needs no setup on the RavenDB side. The date-window queries Power BI sends are translated to RQL range filters and run like any other query. You configure the whole thing in Power BI by defining the RangeStart and RangeEnd parameters and a refresh policy.
Is the connection encrypted?
On a secure server, yes. It accepts PostgreSQL connections only over TLS, and refuses a non-TLS connection before the client sends its password, so the password never travels in the clear. On a server that is not set up as secure, RavenDB requires no authentication over the protocol at all, which means the credentials you created are not checked. Do not expose an unsecured server this way.
Summary
In this article, we loaded documents from RavenDB into Power BI over the PostgreSQL protocol. We enabled the protocol in settings.json, created the credentials Power BI authenticates with, connected from Power BI Desktop, and built a chart from the Northwind orders. We then filtered the data with a query at import time, so RavenDB narrows the result set instead of Power BI loading everything and slicing it afterwards.
Along the way we covered the licensing requirement, the two settings keys the feature needs, the choice between Import and DirectQuery, and how incremental refresh works without any setup on the RavenDB side. From here, point the same connection at your own collections and build the reports you actually need.