Leverage RavenDB Observability with Datadog

Why monitor RavenDB with Datadog?
Continuous monitoring is essential to determine when your application's health is in danger. Usually, you need to manage not only your database, but ultimately your entire system; you require a robust solution that monitors it and raises alerts if something’s wrong.
One of these is Datadog, a cloud platform designed to enhance the observability of your apps. It's powerful, easy to set up, and gives your team a clear view of the system's health. It packs all observability tools in one place, customizable dashboards, real-time alerting, and other treats to keep your team ahead of problems.
RavenDB has rich observability, including OpenTelemetry support and built-in metrics. Thanks to that, applications like Datadog can leverage it, combining it with different parts of your system to provide detailed application health status, not just a single element, and alert you when anomalies are detected.
In this article, we will walk you through connecting RavenDB with Datadog. With just a few steps, Datadog will start pulling RavenDB metrics, providing insights into your application’s health. With increased database monitoring, you can sleep calmly. If something happens to your database, Datadog will alert you immediately. Like Cerberus guarding Hades, he will be watching over your database relentlessly. 🐶
This way, we can monitor RavenDB alongside other systems in one place without needing to access Studio separately. You can even check it on your phone, as there is an official Datadog app, making you always just a few clicks away. You don’t need to check it; you will get a notification when required.
Let’s show how to set up a simple dashboard for RavenDB on-premise or create a high CPU usage alert so you will always know that something is happening to your database, that will seamlessly integrate with other system components.
What you will need
What you will need:
In this article, we will use Docker to run the agent, simplifying the setup process. The agent is a native application for Datadog that collects and sends your metrics. Docker will host the agent in an isolated and portable container environment while allowing it to listen to RavenDB.
Note: If you don’t want to use Docker, you can install the Agent directly on your machine and skip the next section.
Run the Datadog Agent in Docker
To connect your RavenDB, we need to establish a connection between Datadog, its Agent, and RavenDB.
We will create a Docker Compose file to run it with a single command. You just need to fill in the placeholders. First, let’s open this file and paste this definition.
services:
  datadog-agent:
    image: datadog/agent
    container_name: dd-agent
    cgroup: host
    pid: host
    environment:
      - DD_SITE=<DATADOG_REGION>
      - DD_API_KEY=<DATADOG_API_KEY>
      - DD_OTLP_CONFIG_RECEIVER_PROTOCOLS_GRPC_ENDPOINT=0.0.0.0:8888
      - DD_OTLP_CONFIG_METRICS_RESOURCE_ATTRIBUTES_AS_TAGS=true
    volumes:
      - /var/run/docker.sock:/var/run/docker.sock:ro
      - /proc/:/host/proc/:ro
      - /sys/fs/cgroup/:/host/sys/fs/cgroup:ro
    ports:
      - "8888:8888"
    networks:
      - default
    restart: unless-stopped
To set it up, you need to paste the API key. To get it, open your Datadog account, go to ‘Organization settings’ and pick the ‘API Keys’ page. Watch out here, ‘Application Keys’ is a separate page sitting right next to it, and an application key will not authenticate the Agent. Create a new API key, copy it, and replace <DATADOG_API_KEY> with it in the file. Also, fill in <DATADOG_REGION> with the Datadog site your account belongs to, for example datadoghq.com or datadoghq.eu. Run the terminal in the same directory and use the following command.
docker compose up -d
This should create a working Agent in a Docker Container. Once that is ready, we can continue with the RavenDB setup.
Enable OpenTelemetry in RavenDB
Next comes the settings.json file, which is where you tell RavenDB to start exporting its telemetry and where to send it.
RavenDB ships with an OpenTelemetry exporter built in, so there is nothing extra to install on the database side. Its instruments are grouped into meters you can switch on and off one by one. Server covers the database server itself, with Resources, Requests, Storage, GC, TotalDatabases and CPUCredits underneath it, while Runtime and AspNetCore add .NET runtime and ASP.NET Core metrics on top. The server meters are on by default, Runtime and AspNetCore are not, which is why we switch Runtime on explicitly below.
The useful part of doing observability this way is that RavenDB only ever speaks plain OTLP. The same four lines of configuration feed any OpenTelemetry backend, so Datadog is simply the one we happen to be pointing at today.
In your RavenDB.Server directory, find a file called settings.json. Open it and add the four monitoring options below. The whole file is one JSON object, so the entry before your new block needs a trailing comma. Your file will end up looking something like this:
{
  "DataDir": "RavenData",
  "License.Eula.Accepted": true,
  "Setup.Mode": "Unsecured",
  "Security.UnsecuredAccessAllowed": "PublicNetwork",
  "ServerUrl": "http://127.0.0.1:8080",
  "ServerUrl.Tcp": "tcp://127.0.0.1:38888",

  "Monitoring.OpenTelemetry.Enabled": true,
  "Monitoring.OpenTelemetry.Meters.Runtime.Enabled": true,
  "Monitoring.OpenTelemetry.OpenTelemetryProtocol.Protocol": "Grpc",
  "Monitoring.OpenTelemetry.OpenTelemetryProtocol.Endpoint": "http://localhost:8888"
}
The first two options switch on OpenTelemetry and the .NET runtime meters. The last two are the ones people trip over. Our Compose file starts the Agent on its OTLP gRPC receiver, so RavenDB has to speak gRPC back, and a gRPC endpoint is a host and a port with nothing after it. Append a path such as /v1/traces and the export never reaches the Agent. That path is for traces anyway, and we are shipping metrics here.
Prefer OTLP over HTTP? Then swap both sides. Use DD_OTLP_CONFIG_RECEIVER_PROTOCOLS_HTTP_ENDPOINT=0.0.0.0:8888 in the Compose file, set the protocol to HttpProtobuf, and point the endpoint at http://localhost:8888/v1/metrics. Every one of these settings, along with the ones we are not using, is documented in the monitoring configuration reference.
Two things here are fine on a development machine and not fine anywhere else. The Compose file publishes the Agent’s OTLP port on 8888, and the settings.json above runs RavenDB with Setup.Mode set to Unsecured and unsecured access allowed on a public network. On a real server, bind the OTLP port to loopback or to a private network that only the Agent and RavenDB share, and run RavenDB with certificates instead. Our security overview walks through the secured setup.
After adding those to your file, save it, and launch RavenDB.
Let's go to Datadog and see how we can access that. Remember that you still need the Datadog Agent running (in our case, in a Docker container).
Build a CPU dashboard and a high-CPU alert
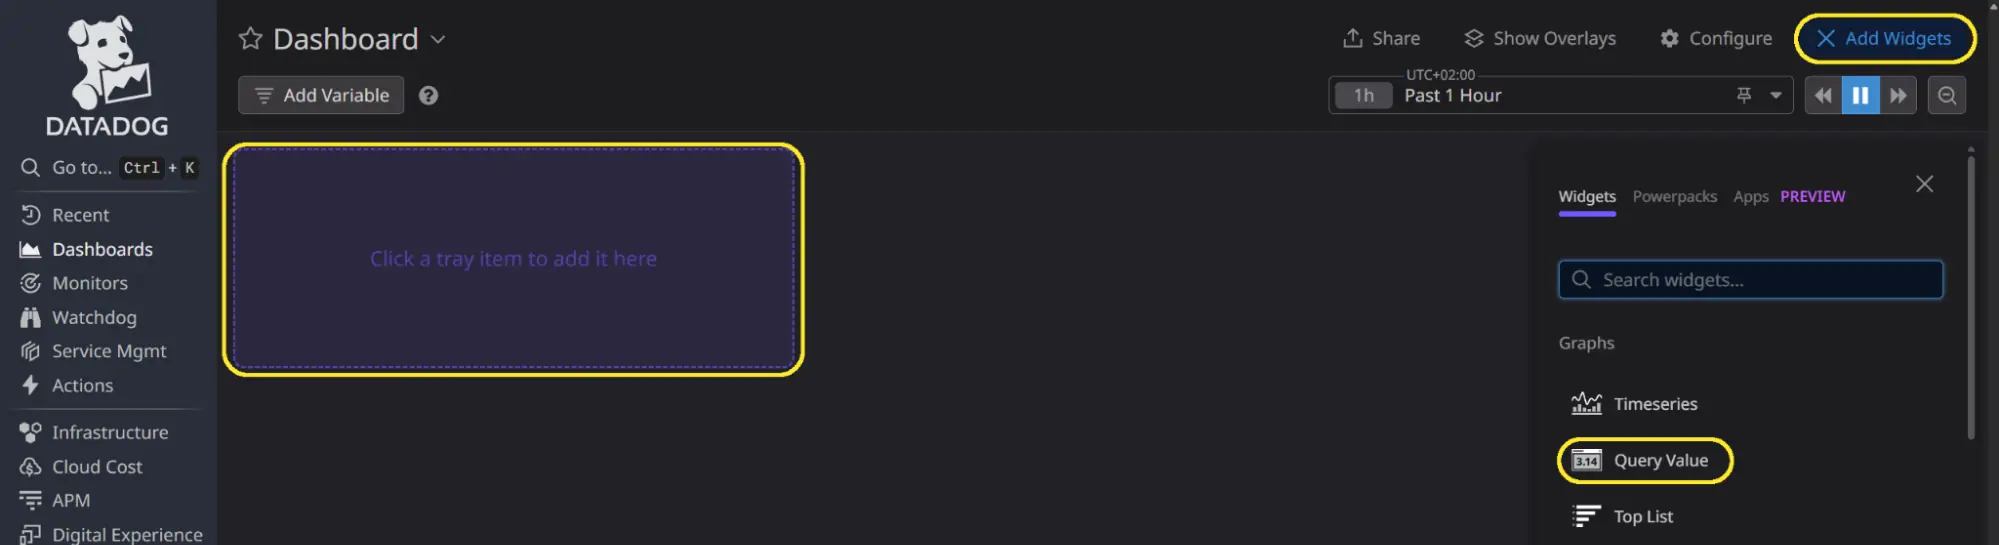
Let’s take a few metrics and place them on a dashboard. Go to the ‘Dashboards’ menu and click the ‘New Dashboard’ button on the top right. Now let’s add some visualisation. Click on ‘Add Widgets or Powerpacks’ or ‘Add Widget’, where the button for the new dashboard was, and select the desired option. We will choose the query value type.
Here we will edit our widget. In the 'Graph your data' step, create a query, the default one is labeled as ‘a’, make sure 'Metrics' is selected. We select the second field (one that is yellow) and you may see other metrics here, RavenDB ones start with ‘ravendb’. We will choose ‘ravendb.server.resources.cpu.machine’.
Two RavenDB CPU metrics are worth telling apart before you build dashboards and alerts on top of them:
| Metric | What it measures | Reach for it when |
|---|---|---|
ravendb.server.resources.cpu.machine | Machine CPU usage in %, everything running on the box | You want to know whether the host is saturated, no matter who is to blame |
ravendb.server.resources.cpu.process | Process CPU usage in %, the RavenDB process on its own | You want to know whether RavenDB itself is the one burning the cycles |
We use the machine metric here because on a server you own, that is the honest first question. If RavenDB shares the machine with your application, chart both, otherwise you will end up paging yourself over a noisy neighbour. The full list of instruments RavenDB exports lives in the OpenTelemetry support reference.
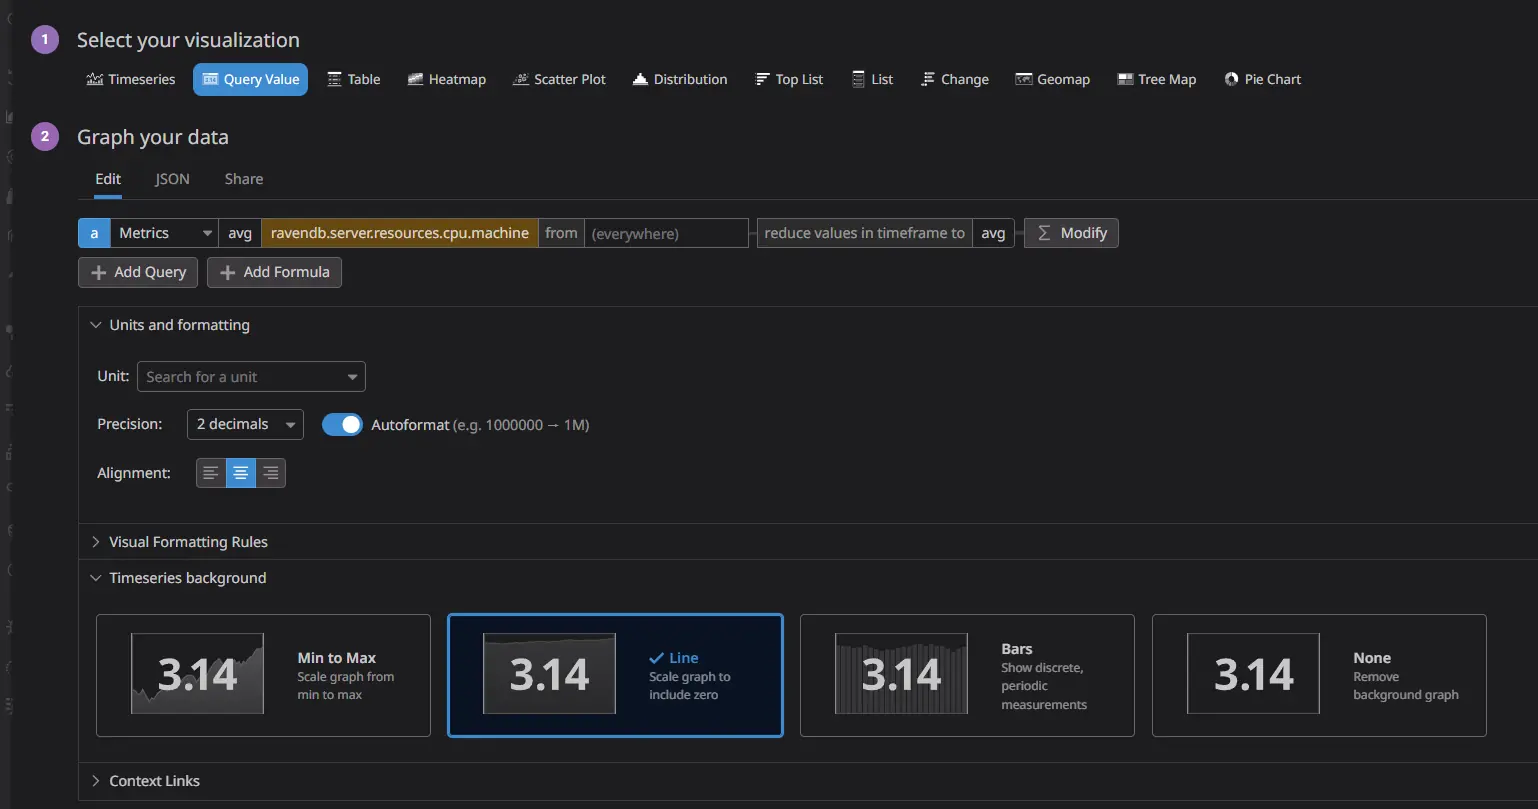
Save the widget. If you set up the widget correctly, you should see the data, as OpenTelemetry sends it every minute.
Let’s create a new monitor that alerts us when CPU usage gets high.
Set up a high-CPU monitor
Monitors are used to connect other elements of your Datadog. You can connect metrics with teams, tags, incidents, and other components to create the notifications you need. When the dashboard allows you to view your metrics in one place, monitors let you set warnings and alarms, so with a single glance, you can see if any element of your database is in trouble.
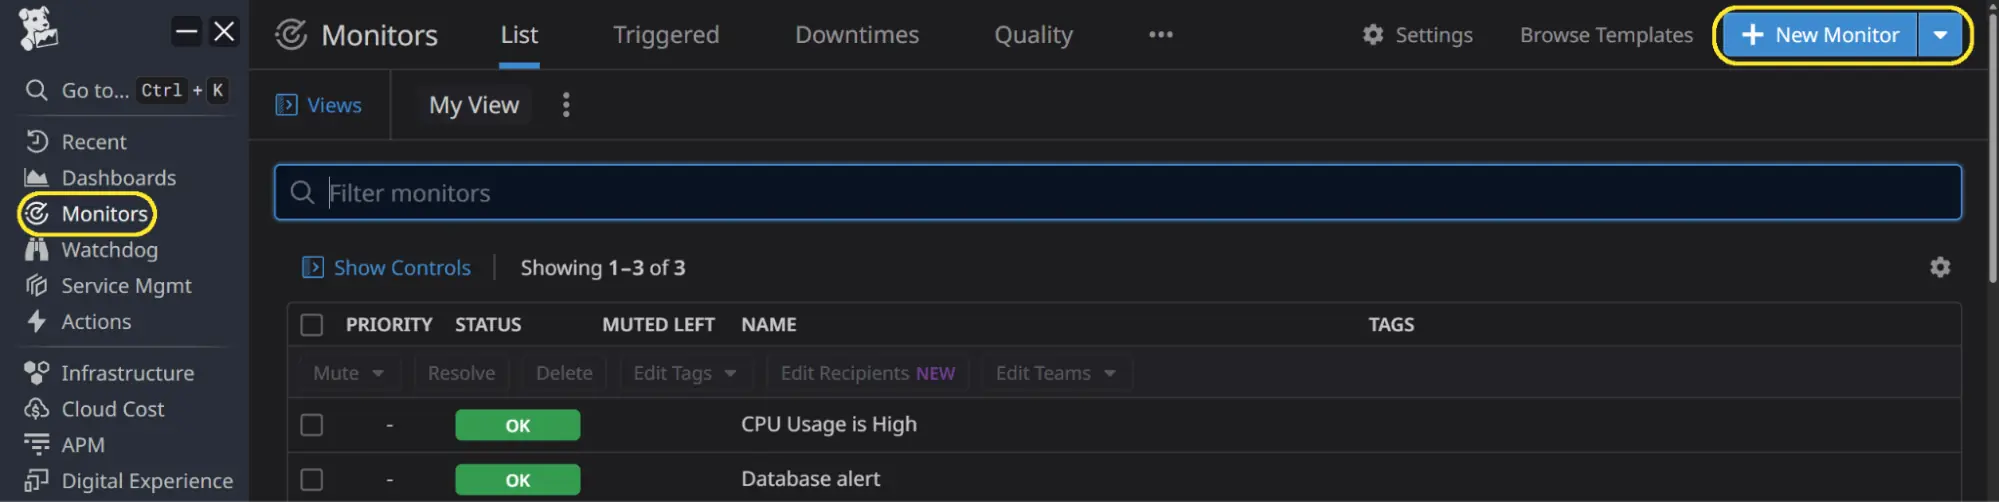
On the left bar, find the ‘Monitors’ section. In there, you can click on the top right to create a new monitor. Select ‘Metrics’ as monitor type. The process of configuring the monitor has been separated into five steps.
- Choose the type of monitor we want to have; for this article, we chose a simple threshold alert.
- Select what you want to be alerted to; we chose CPU usage, just as we did in the widget. Configure details such as the amount of time evaluation takes into consideration.
- Select thresholds to determine when our alerts should be triggered. We can select a warning or an alert to ring. Set the warning to warn us above 75%, and then start alert above 90% of CPU usage.
- Define the notification that you will receive. Those messages support markdown and variables, allowing for effective communication. For this, we will use the following notification.
{{#is_alert}} CPU usage above 90% {{/is_alert}}
{{#is_alert_to_warning}} CPU usage above 75% {{/is_alert_to_warning}}
{{#is_alert_to_warning}} CPU usage under 90% but still high {{/is_alert_to_warning}}
{{#is_alert_recovery}} CPU usage is back to normal {{/is_alert_recovery}}
At the end of this step, you can also choose metadata about priority, tags, and the team.
- Assign permissions for this monitor, then click save. Let’s see if the alert works.
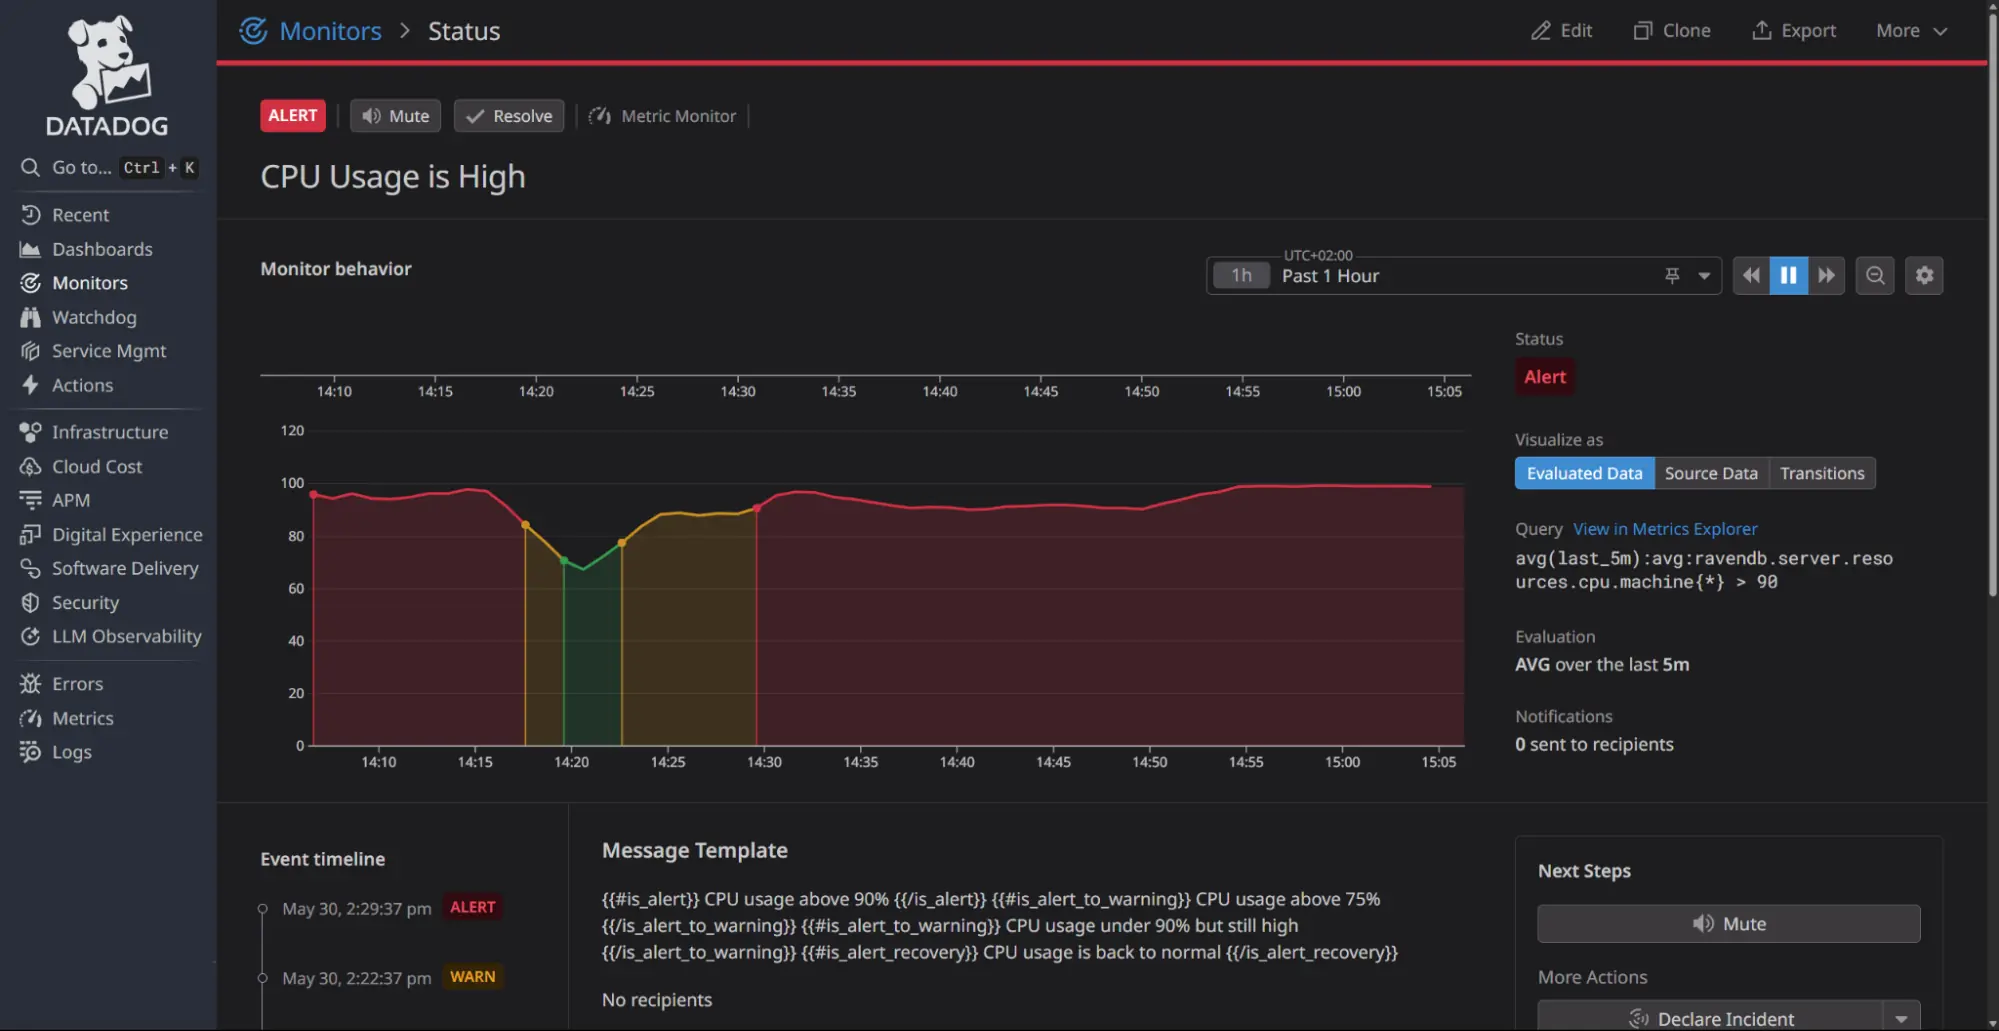
As you can see, it works. I’ve caused high CPU on purpose. When an alert like this fires for real, our guide on troubleshooting high CPU usage walks through tracking down what is actually eating the cycles. The last step is to select who should receive notifications from these alerts. To send your notifications, just add @Chosen_group_or_email in the chosen notification level. For example:
{{#is_alert}} CPU usage above 90% @IT-team {{/is_alert}}
A test button is located at the bottom right, next to the save button, to check if notifications are sent. For more information about monitors, refer to the Datadog documentation here.
Of course, there are many more options for notifications, allowing you to customize them to your specific needs, such as automatically starting incidents or automating your end-to-end processes with workflows.
Check your dashboards from the Datadog mobile app
Additionally, don't forget that Datadog offers a mobile app that allows you to monitor your systems on the go. There is also an option to pin a widget with your chosen items or incident log to your main screen, changing your normal phone into a powerful observation tool. You just log in on your mobile device, where you can access all your dashboards and monitors everywhere you have a connection.
Summary
Now it’s your turn. We ran the Datadog Agent in a Docker container, pointed RavenDB’s OpenTelemetry exporter at the Agent’s OTLP gRPC receiver, charted machine CPU usage on a dashboard, and wired up a monitor that warns at 75% and alerts at 90%. From here you can add the rest of the RavenDB instruments, hook the monitor into your teams and incidents, and relax, as everything is watched over for you.
Datadog is not the only backend that speaks OpenTelemetry. If Grafana is more your thing, the same RavenDB settings feed Grafana Cloud, and you can send your RavenDB logs there too.