How to Troubleshoot High CPU Usage in RavenDB

What you will learn
- Common high CPU usage problem causes
- Difference between Current CPU Usage and Total CPU Time
- How to use tools to investigate your problem of high CPU usage
Introduction
High CPU usage can be a challenging issue for anyone. Whether you noticed it on the RavenDB dashboard or started investigating why your tasks take so long to finish. In this article, we will do our best to find the cause. Whether your issue is with Current CPU Usage or Total CPU Time, this guide can help you identify the root of the problem or give you the tools to do it yourself.
Common Causes
Before we attempt to detect the reason for your server's high CPU usage, let's check if one of the following common cases isn't happening.
Indexing Workload
During indexing, your CPU usage can skyrocket if you set up many indexing requests for your database. Review your index definitions to find problems in the code itself. The tell-tale sign is threads named Idx sitting at the top of your CPU list, plus an Indexing Performance view full of indexes that keep re-running instead of settling down. If that is what you are looking at, our guide on spotting red flags in index definitions covers what to look for.
Creating a backup
If your database periodically experiences high CPU usage, periodic backups may be a factor causing these problems. Consider changing the frequency of your backups. You can check your database backup options at Tasks and Backups. The give-away here is timing. If your spikes land on a schedule rather than following your traffic, compare them against your backup window before you look anywhere else.
Heavy queries
Queries that pull back whole documents, project a pile of fields, or run without a sensible page size will burn CPU on every single call, and a busy application makes that add up fast. The Running Queries view shows you what is executing right now, which is usually enough to catch the one query doing all the damage.
Encryption
Encryption is not free. Every page has to be decrypted on the way in and encrypted on the way out, so an encrypted database will always run hotter than the same database without it. That is expected rather than broken, but it is worth knowing about if you switched encryption on in production without measuring the cost first.
Ongoing tasks
ETL tasks, external replication, and subscriptions all do serialization and transformation work on the server itself. A handful of them is nothing to worry about. A lot of them, or a few with expensive transform scripts, will show up on your CPU.
External factors and bugs
Bugs in your connected application or other server processes can influence your CPU usage. Check your machine's other running processes and applications. While you are here, it is worth ruling out memory pressure too, because a server fighting for memory often looks a lot like a server fighting for CPU. Our guide on high memory usage covers that side of it.
Current CPU Usage and Total CPU Time
Now let's break down what we're looking for through the analysis. Two metrics will be helpful for us: Current CPU Usage and Total CPU Time.
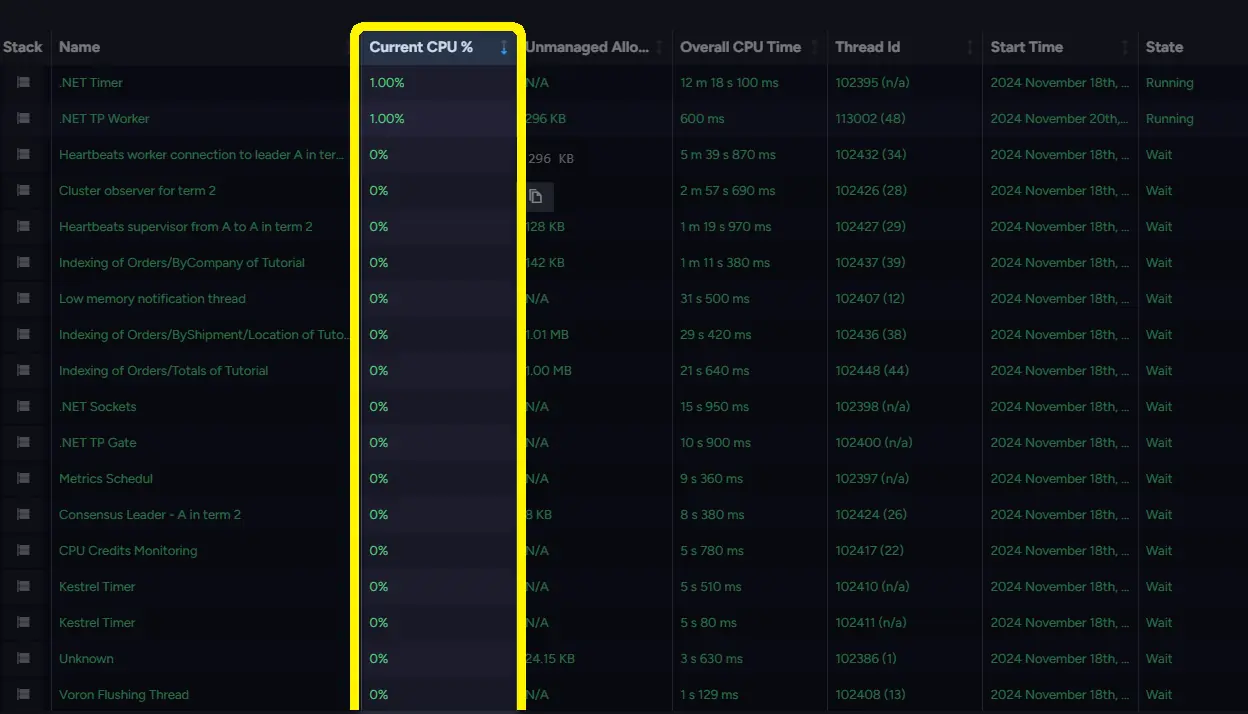
Current CPU Usage (In RavenDB called Current CPU %) informs us of the percentage CPU on your machine used by our processes. This metric is continuously monitored and updated. It is helpful in detecting "spikes" of CPU usage (short-term usage bursts). In extreme cases, it will also clearly show overall high usage.
On the other hand, Total CPU Time (in RavenDB called Overall CPU Time) is a metric that informs us about CPU usage in the long term. It measures the time consumed by the process since it started. Depending on the tool, it can be as precise as measuring milliseconds of CPU work. Since it is calculated from the start of the process, it can be used to monitor the overall performance of your server.
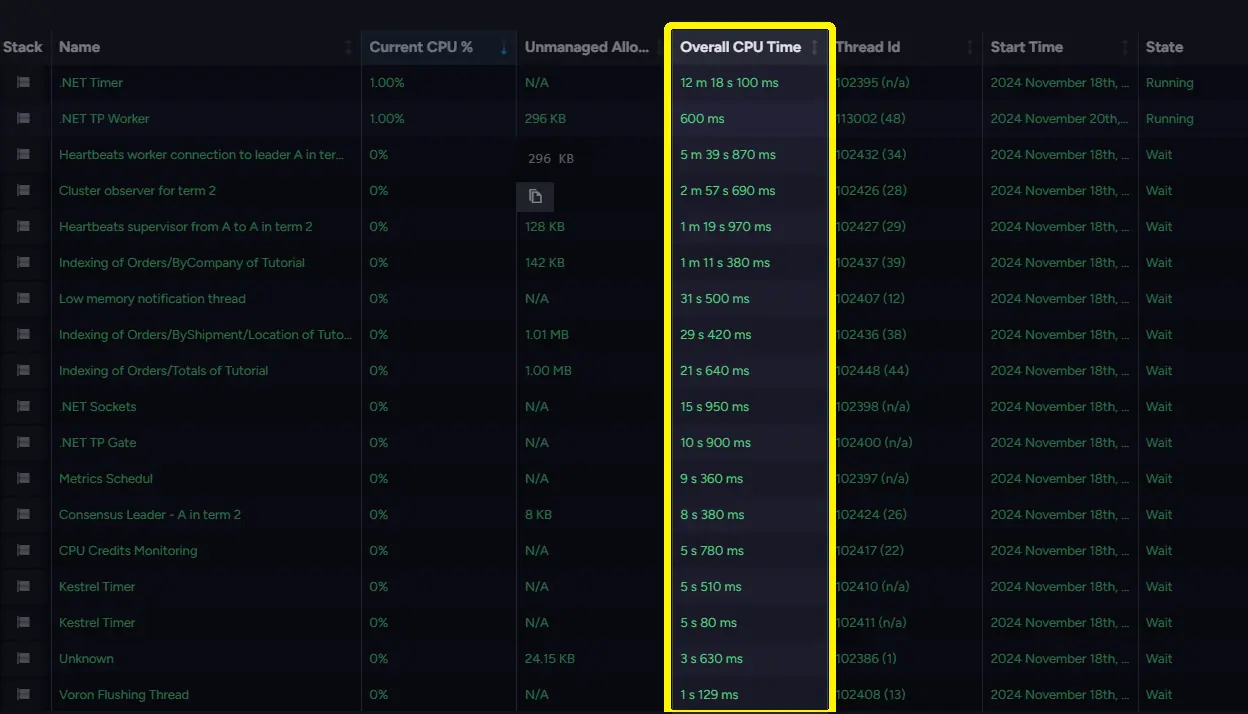
As we can see, they are two different metrics for different uses. Both complement each other, allowing us to investigate the database server performance.
Investigating
Depending on if you are hosting your database on your machine or you are using RavenDB Cloud, you can monitor your CPU using different tools.
Linux
If you are running your machine on Linux, you can do it with two programs. Both are launched using the terminal and its top -H and htop -H. -H immediately launches those programs in threads mode. If you forgot to add -H, just press SHIFT+H to switch it. In this article, we are using Ubuntu-based Linux. If you are using a different Linux distribution, please check what commands will work for you.
Top
The top command is a part of the procps package, a common component of Linux systems. Type top in the terminal to check if it's already there.
If it's not, let's break down how to install it. First, update your packages. You can do this with the following command:
sudo apt update && sudo apt upgrade
Then, install the procps package by executing the following command (use sudo to elevate permissions):
sudo apt install procps
As mentioned previously, this will give you access to the top program, but you want to use top -H. -H allows you to view threads instead of full processes. -H can be triggered with a command, or you can press SHIFT+H to change it when the application is already running.
Htop
Command htop is a bit more advanced and easy to read. It's not a part of the procps package, it's installed separately. Update your packages if you haven't done that recently:
sudo apt update && sudo apt upgrade
Now, you can install htop by executing the following command:
sudo apt install htop
This will download and install the htop on your machine. It is a bit more comprehensive than top so you might prefer it. As mentioned before, use the command htop -H to check threads instead of just processes, or press SHIFT+H to change it when the application is already running.
Investigating on Linux
Let's continue the investigation. Try top and htop to find out which interface suits you better, as both give most of the information we need.
top -H
htop -H
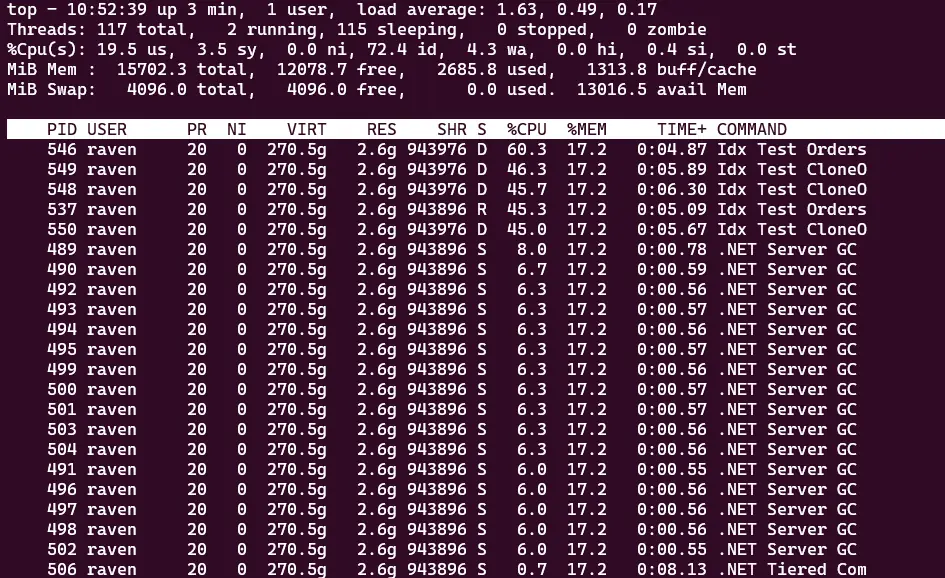
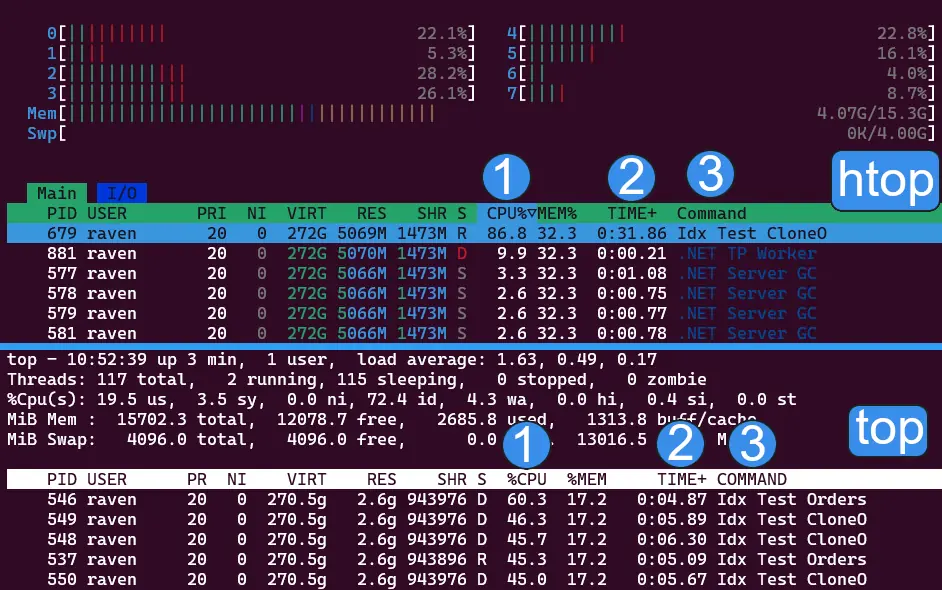
Take a look at two columns (1 and 2). First, you have %CPU (top) or CPU% (htop). Current CPU Usage is expressed in percentage. TIME+ indicates Total CPU Time. Additionally, htop shows CPU usage of every core of your CPU at the top of your window. Look at the pictures and notice the high CPU usage, which means something CPU-demanding is happening right now. However, in the COMMAND (3) column, we can see that I set up some indexing (Idx is the indexing thread) for example purposes. This way, using standard tooling, we can properly investigate the cause of our problem and draw a conclusion.
Windows
Sadly, Windows has no easy way to access specific thread information. We have access to threads in Task Manager and Resource Manager, but those two are too imprecise, and usage is too time-consuming to be worth it. Your best shot is to use the RavenDB tools explained below. They give you easily readable and complete information about your database. You can also search for a third-party tool suited to your needs.
RavenDB
RavenDB has ready-to-go solutions: use RavenDB's Studio widgets. We have prepared a dashboard where you can use widgets to monitor your database.
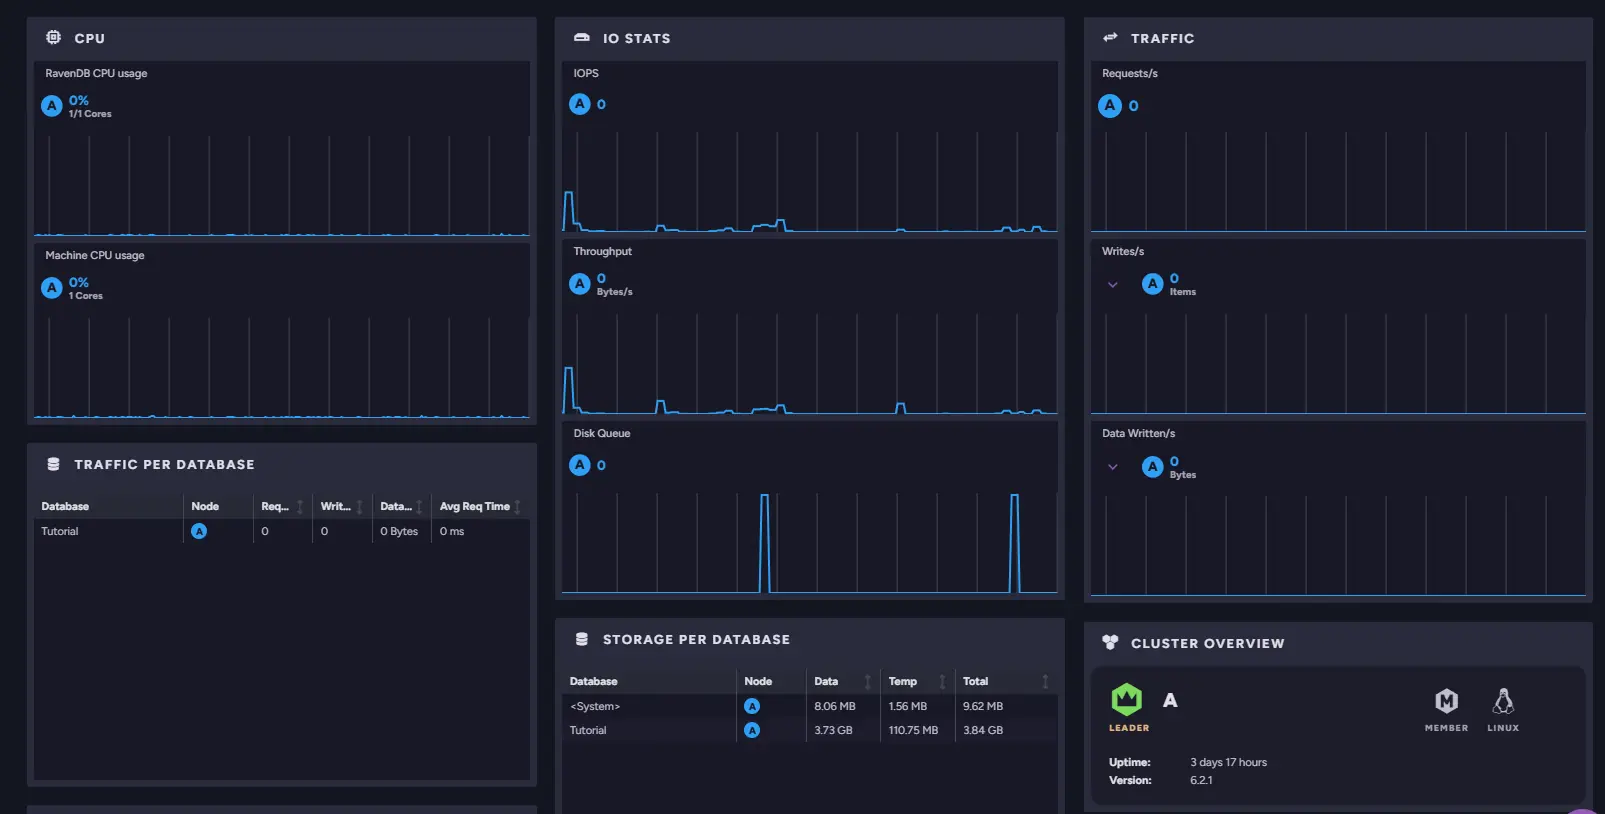
The CPU widget monitors CPU usage and is the first place to spot potential issues.
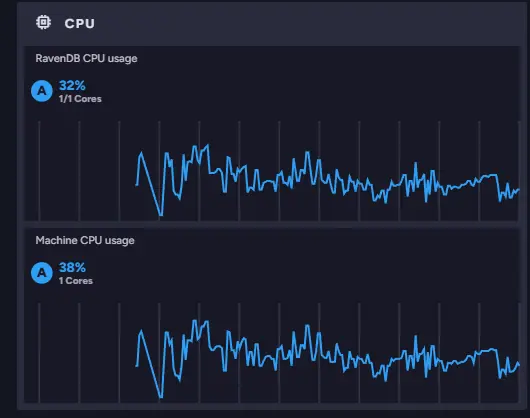
It shows the current CPU usage plot, which informs us about current and overall performance. This widget, combined with others like traffic or indexing, can help you find problematic threads.
Let's gather more information about your CPU usage and threads. Select Manage Server on the left bar and find two useful tools there. The first tool you can use for more precise analysis can be found in the Manage Server category on the left bar. It's called Advanced.

We are interested in the Thread Runtime Info section that was selected by default. It gives us access to the useful chart of our threads.
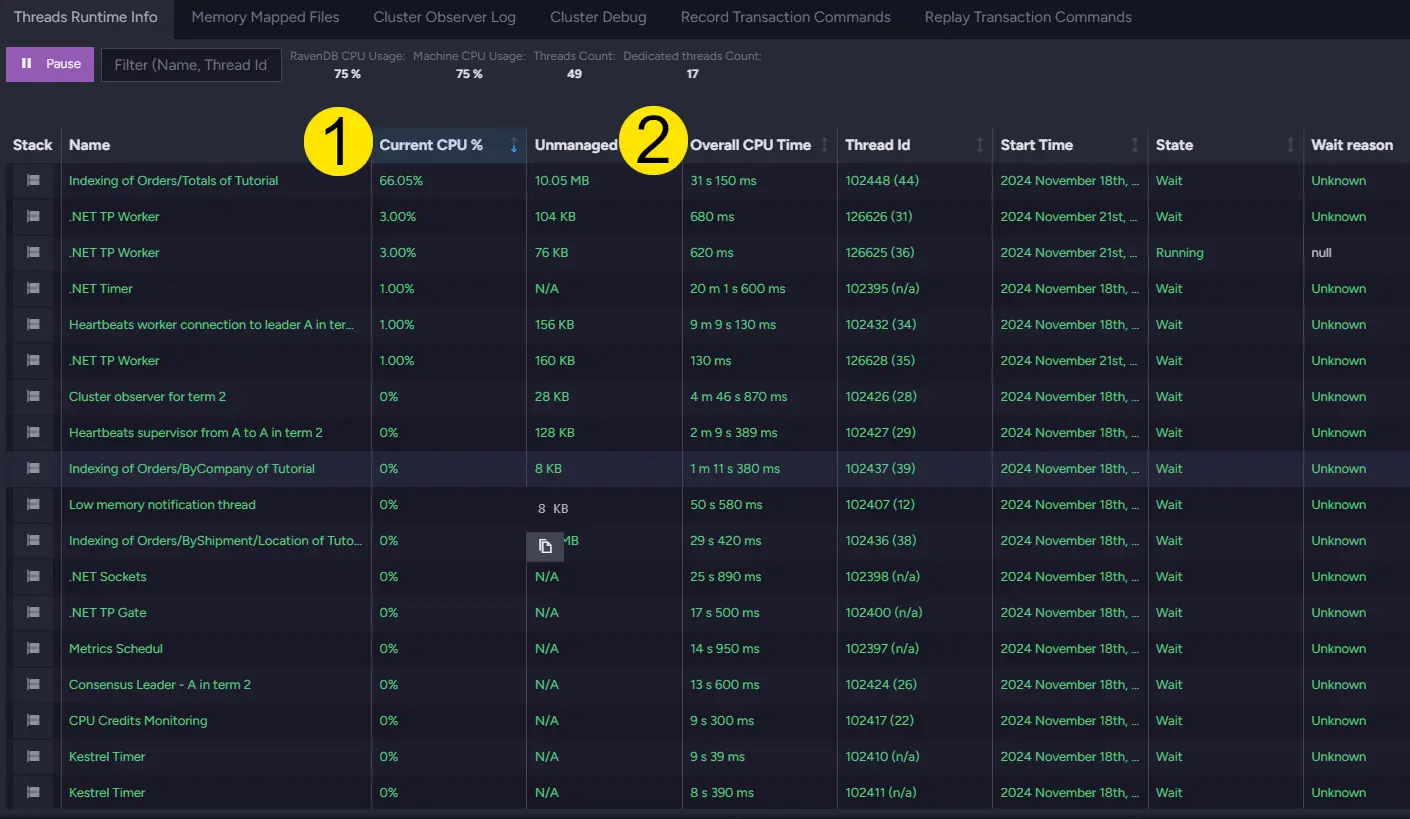
Here you can find two useful columns, just like in top commands. Current CPU % (1) and Overall CPU Time (2). In the screenshot above, you can see that Current CPU Usage is high. Looking at the name in the left column, you can say that I set up indexing to create this example. You can also notice that it may be eating a lot of CPU currently, but Overall CPU Time shows that it's not using much in the long term.
The second tool you can use is Stack Traces. This tool allows you to analyze your data visually. To get there, you again choose Manage Server on the left bar and select Stack Traces.

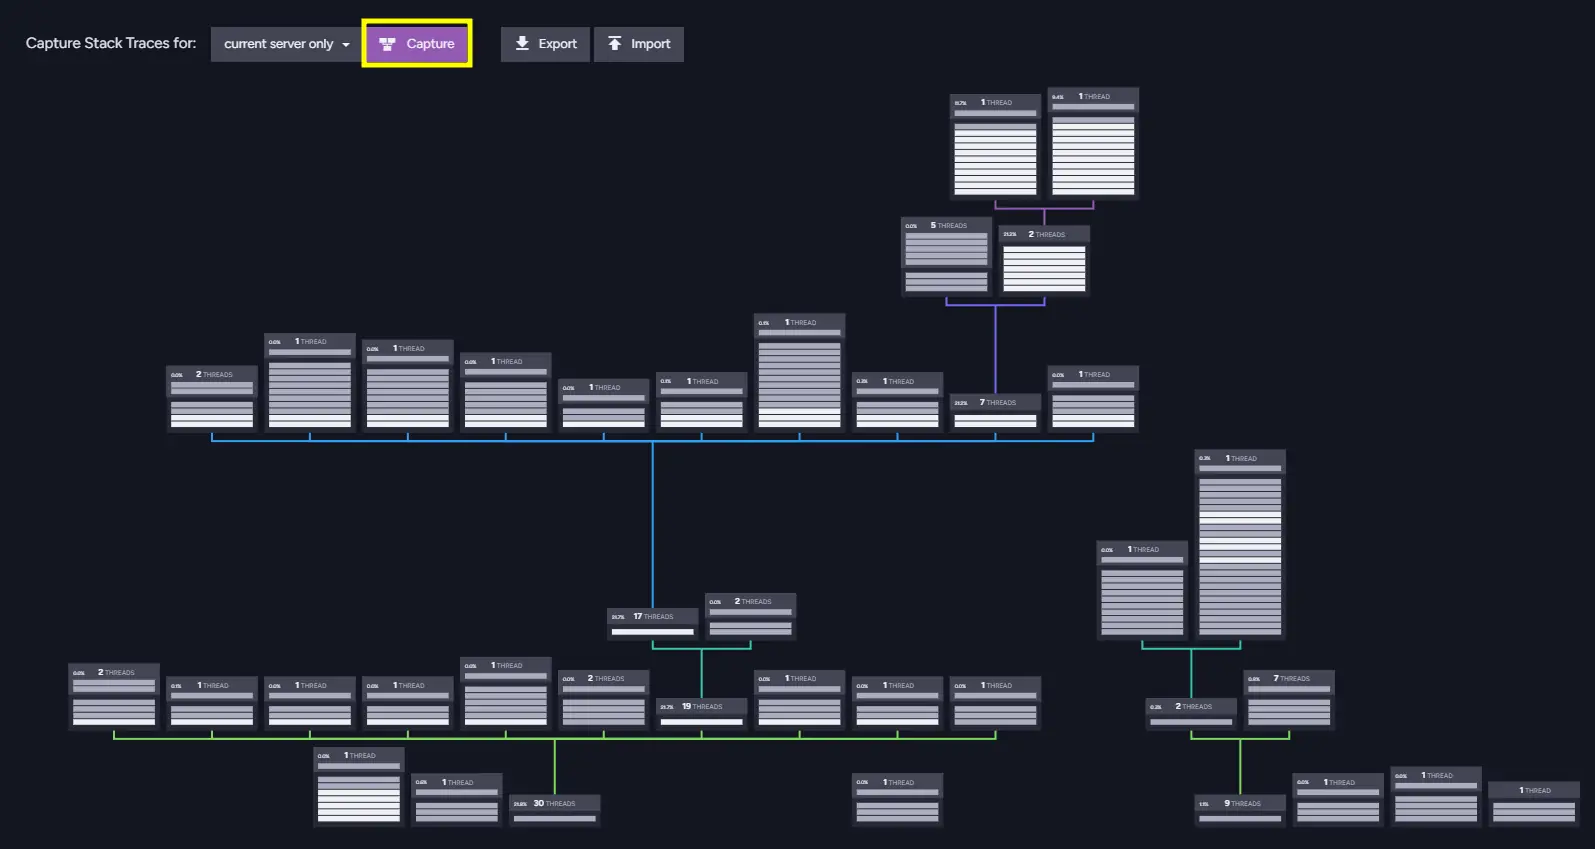
To use Stack Traces, you need to click Capture. After a short wait, you can see the thread tree. This tree cannot show you your Total CPU Time, but it can benefit you in other ways. It shows all connections more precisely for the human eye and allows you to not only find the root of the problem but also to find bottlenecks or where many threads create one. If you need, you can even zoom in and precisely see what each box is doing. For example:
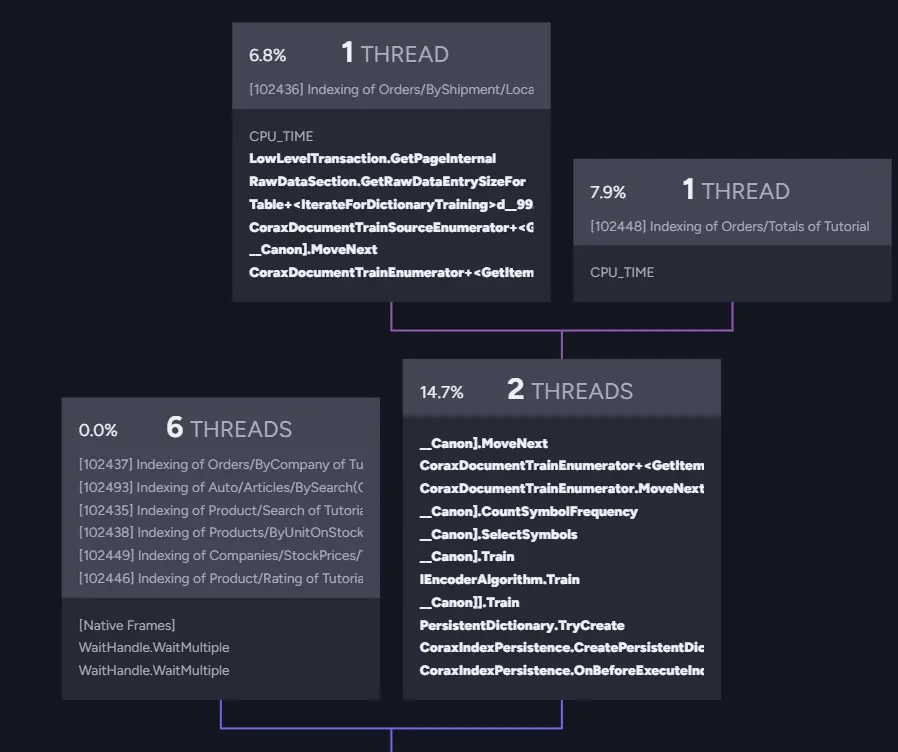
This gives you the exact percentage of what the stack does so you can analyze it. This case is the same as previous ones. The cause of high CPU usage is threads doing indexing. You can notice that by looking at the gray text at the top of two top stacks. Because it's indexing, I can review my indexing definitions or just wait for them to finish, so it will stop using this much CPU.
Summary
This article explored ways to identify your CPU problems, introducing common issues that users can experience. We also explained tools like top, htop, and in-built RavenDB tools for quick and efficient CPU usage checks.
The table below summarizes tools you can use for your investigation.
| Platform | Tool | What it shows |
|---|---|---|
| Linux | top -H | Current CPU Usage (%CPU) and Total CPU Time (TIME+), per thread |
| Linux | htop -H | The same per thread, plus per-core usage, in a friendlier interface |
| Windows | RavenDB Studio | Default Windows tools are too imprecise for per-thread work |
| Any | CPU widget | Current CPU Usage over time, on the Studio dashboard |
| Any | Thread Runtime Info | Current CPU % and Overall CPU Time per thread, under Manage Server |
| Any | Stack Traces | A capturable thread tree with the share of work per stack, under Manage Server |