How is my database today?

Your application seems slower than usual. Nothing is completely broken, but something is clearly wrong. If you aren’t working with the same app for several years, the real challenge can be not fixing the problem itself, but knowing where to start looking.
In this guide, we will explore several areas of RavenDB Studio that help you investigate what is happening inside your database or cluster. Each of them provides different information on the system, helping you gradually narrow down the possible causes of a problem.
Know your system
One of the most useful habits when working with any database system is simply learning how it behaves on a normal day.
RavenDB Studio provides several tools that help you observe different parts of the system. Some show the overall health of the cluster, others reveal what clients are doing, and some show the internal activity of the server. By occasionally checking these views during normal operation, you build an intuition for how your system usually behaves.
That familiarity becomes extremely valuable when something changes. A spike in memory usage, unusual request numbers, or a node behaving differently from the others will stand out much more clearly once you know what the typical baseline looks like.
The following sections introduce several tools that help you understand and observe your system. They can be used when troubleshooting a problem, but they are just as useful for building a general awareness of how your database behaves over time. Remember, knowing the system you work with is one of the most useful and basic maintenance tasks.
Notifications
What it shows:
- Immediate alerts about critical database or cluster issues
Problems it identifies:
- Performance issues
- Ongoing task problems
- Major system warnings
A good first step is checking whether RavenDB has already detected a known problem. Some issues, such as failing ETL processes, replication errors, or low disk space, are important enough that the server automatically raises warnings.
The notification centre in the top-right corner of the studio collects these alerts in one place. If a notification appears there, it can immediately point you toward a specific part of the system that requires attention.
When something is really going badly, it might look like that.
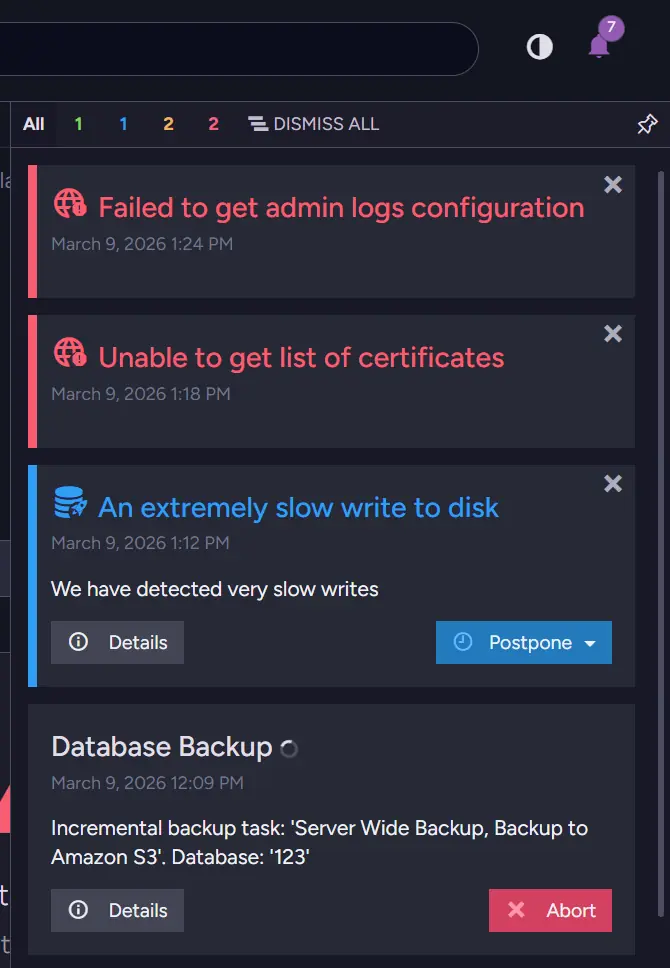
This is an obvious example, but even small notifications can provide useful insight into the system you are working with. We now know that our disk is slow, which can mean a few things. We can suspect that this is Database Backup slowing down the rest of the system, so we can check its details.
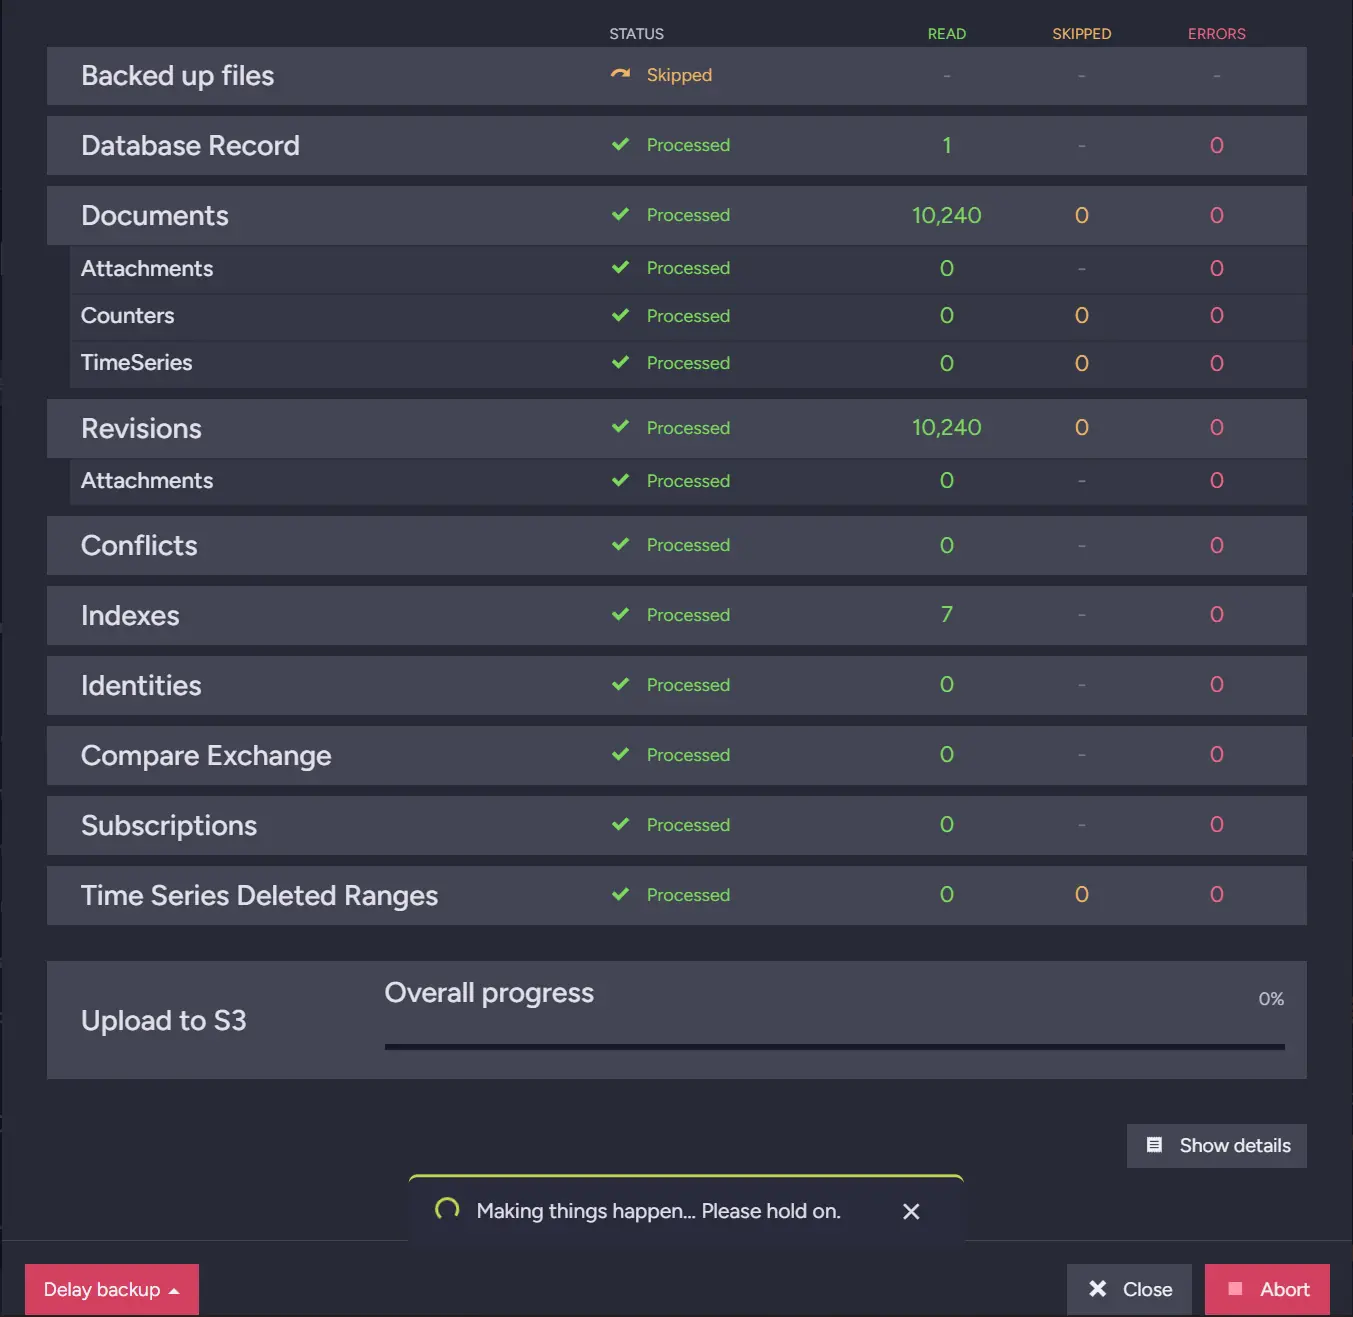
Here we can see that the backup file upload is stuck. From here, we can investigate further, gather information for support, or potentially resolve the problem ourselves. Let’s look at the dashboard and check our resources.
Cluster Dashboard
What it shows:
- Real-time metrics such as CPU, IO, GC, and system load across nodes
Problems it identifies:
- High resource usage
- Memory pressure or GC spikes
- Uneven load across nodes
The Cluster Dashboard is the view that RavenDB Studio opens by default. It provides a modular overview of the server and cluster, allowing you to quickly check the current state of the system.
The Cluster Dashboard is composed of widgets, which can be added or removed from the bottom-right corner.
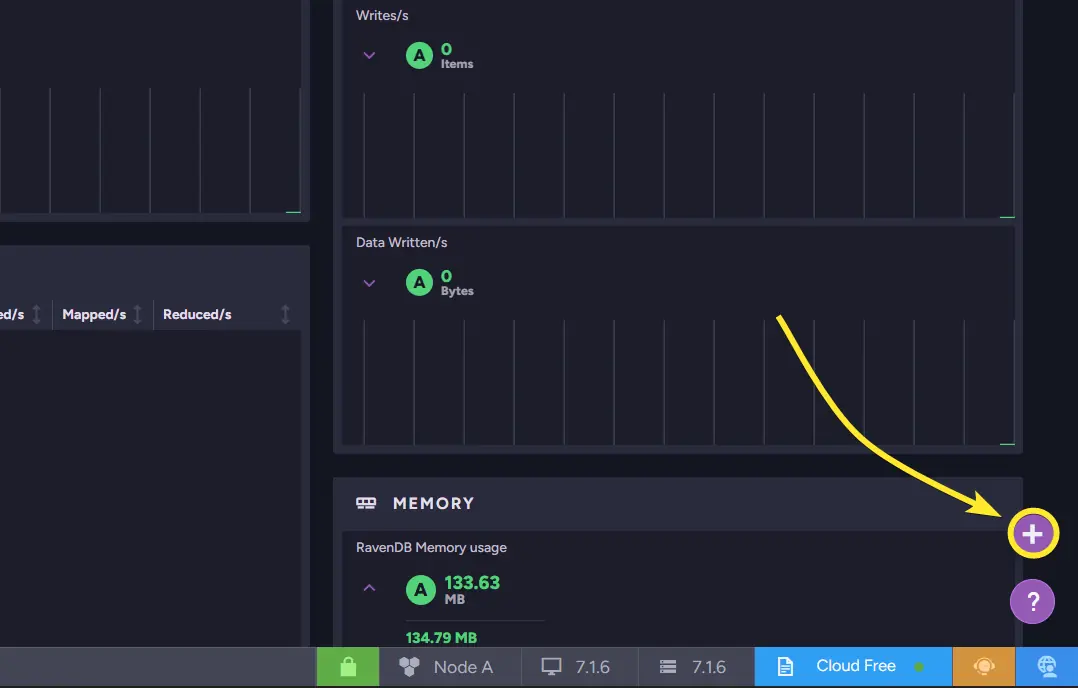
These widgets display real-time metrics such as CPU usage, traffic, IO activity, and garbage collection statistics. By scanning these metrics, you can quickly determine whether the cluster is under unusual load or a core resource is being heavily used. That brings us back to the “Know your system” part of this guide.
Because the dashboard updates in real time, it is often the fastest way to understand what is happening. If the application feels slower than usual, the first thing to check is whether any of these metrics look abnormal.
While scrolling through the widgets, we eventually reach the memory statistics and notice that the instance is using a large amount of memory. High memory usage can affect many parts of the system. This suggests that memory might be contributing to the slowdown.
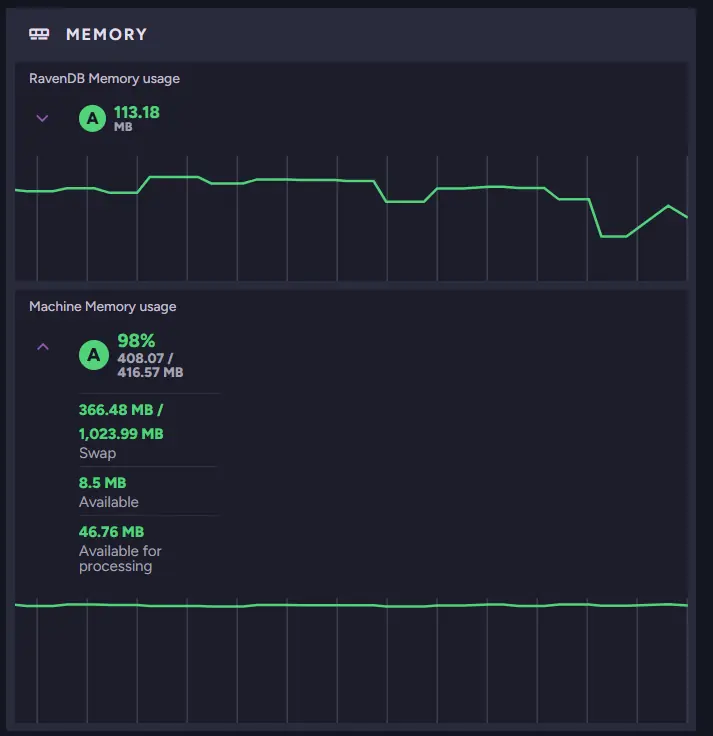
As you can see, only 46 MB of memory is Available for processing, which may be very little depending on the machine. At the same time, we can see that Average Request Time spiked moments ago.
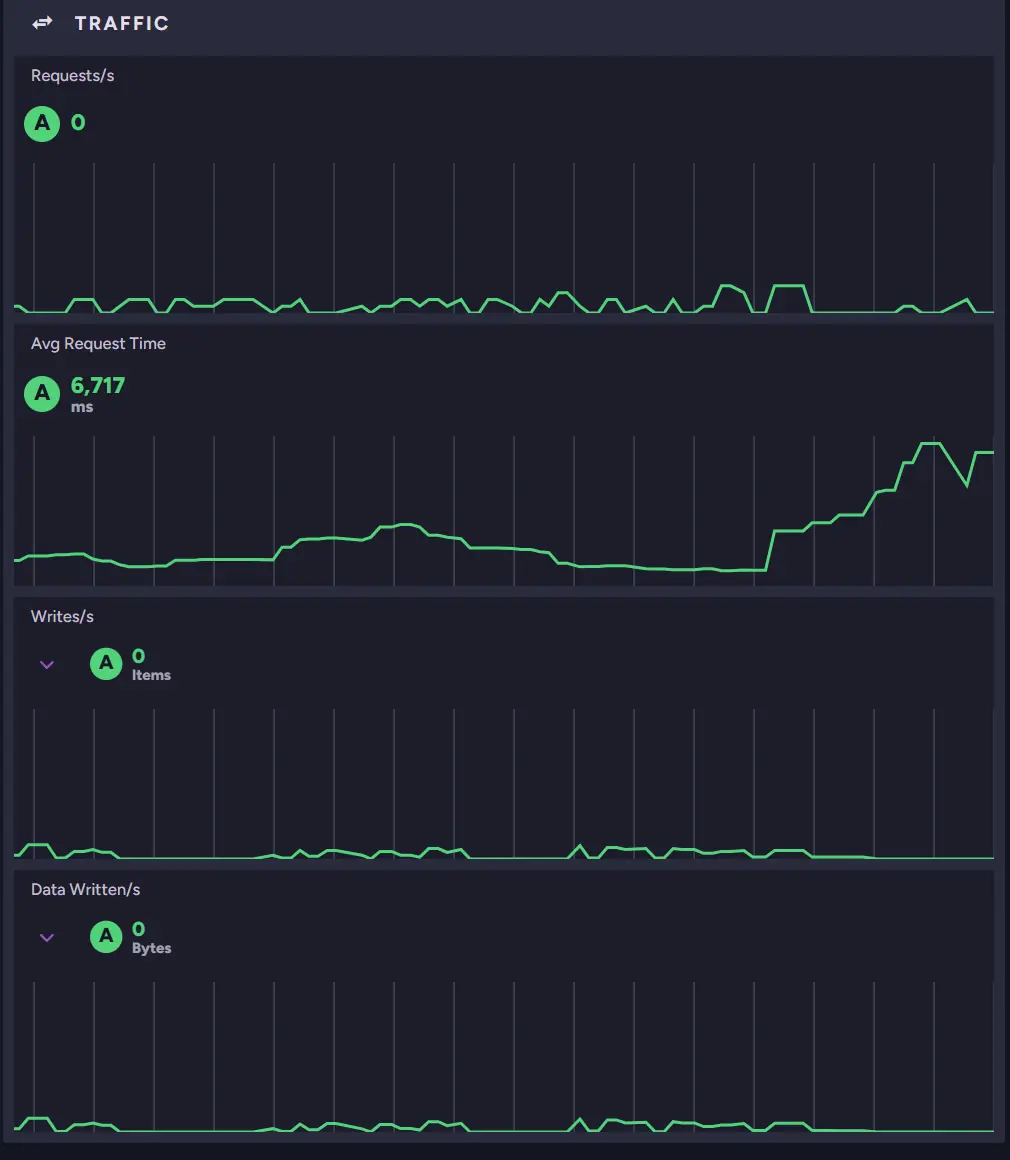
We can also look at other metrics to see if the rest of our systems are fine. For example, we can look at the IO Stats widget.
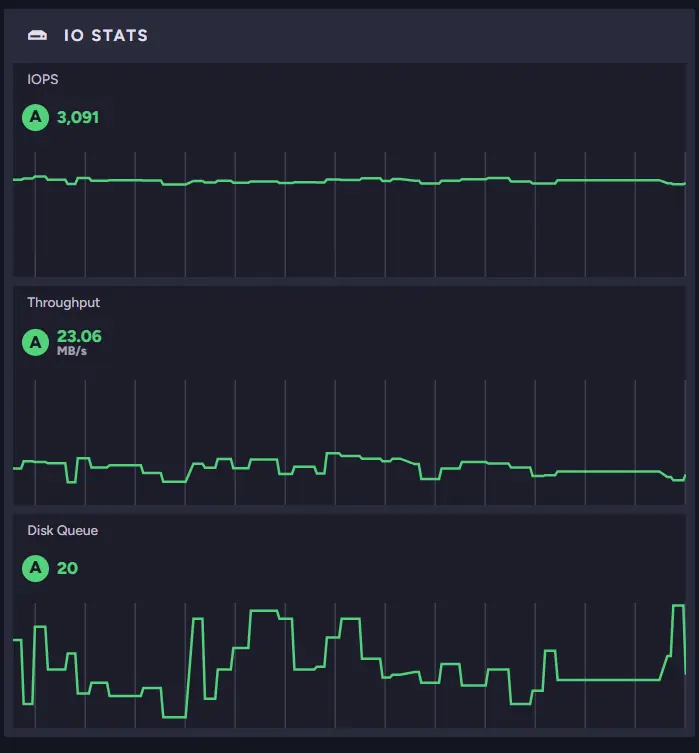
Knowing that this machine can handle only about 500 IOPS outside burst capacity, we can expect performance to drop significantly once the burst credits are exhausted. Being aware of your machine’s limits and “normal numbers” within those widgets can give you much information about the state of your instance.
Cluster Status
What it shows:
- Current state of each node and its relationships within the cluster
Problems it identifies:
- Down or rehabilitating nodes
- Node memory imbalances
- Cluster topology or configuration issues
Sometimes the issue is not related to workload but to the cluster itself. A node might be unavailable, recovering, or not participating correctly in cluster operations. Even when a node is missing, the rest of the cluster may continue running.
The Cluster Status view helps you inspect the health of individual nodes and their topology. It shows how nodes relate to each other and whether any of them are unavailable or experiencing problems. By reviewing this view, you can quickly notice situations where a node is down or under heavy memory pressure.
For example, if the cluster has nodes in different geographical locations, the failure of one node may change response times for users located closer to that server. For users who are away from the rest of the servers, or if load balancing is used, it can affect your database behaviour - e.g., the fastest node can change.
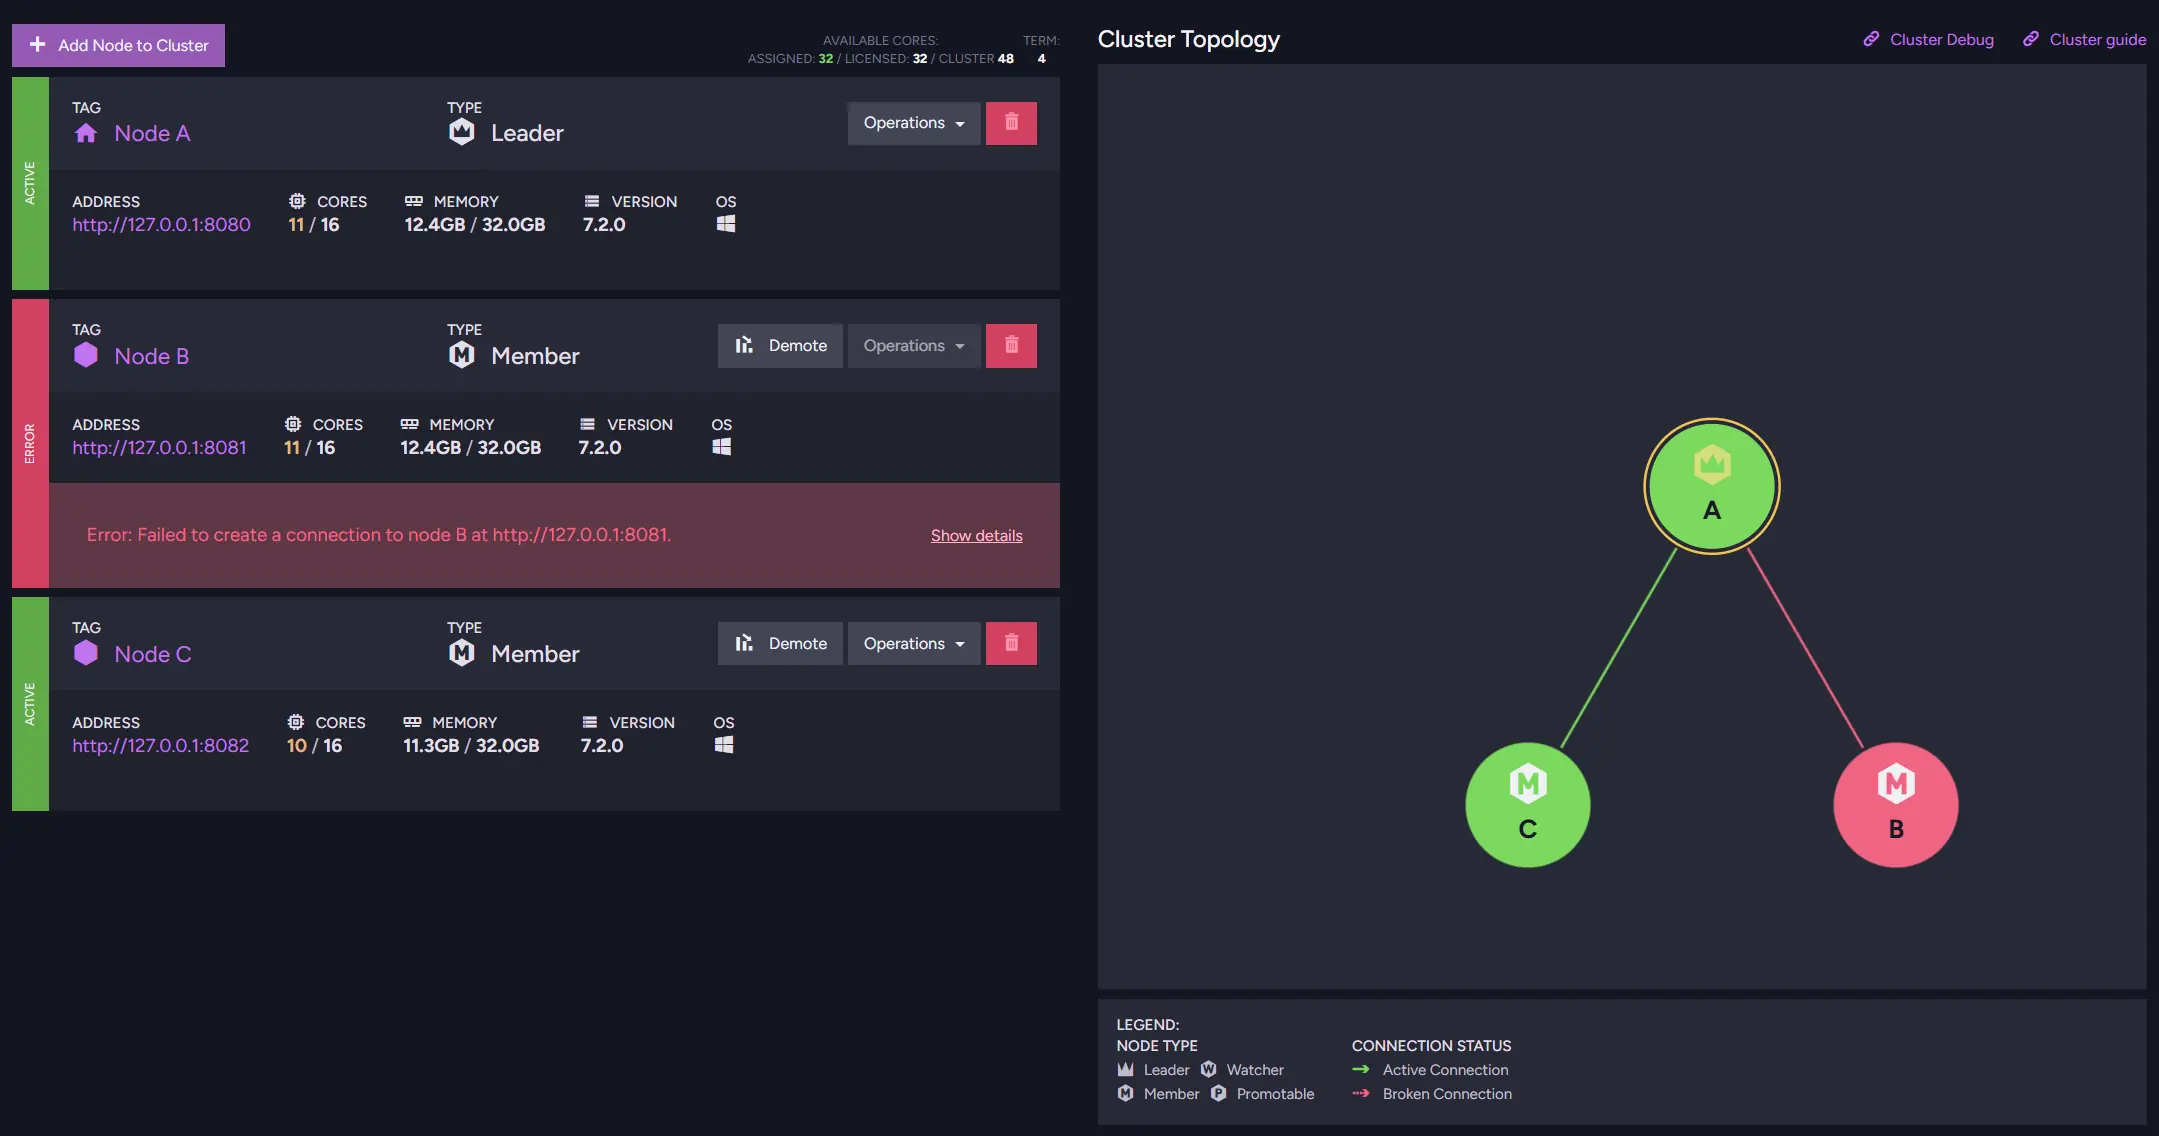
If you see your nodes having uneven workloads, you might want to change the load balance behavior. To further investigate differences in node behavior, you can use Cluster Debug, which provides detailed insights into the cluster’s communication status.
Traffic Watch
What it shows:
- Live HTTP traffic between clients and the cluster
Problems it identifies:
- Unusual or excessive request patterns
- Misbehaving clients
- High requests or response sizes
If the cluster itself looks healthy, the next question is what users are actually doing. Even when the infrastructure is working correctly, the number, size, or complexity of a request can still overwhelm the system. A sudden increase in requests can affect your system if unprepared.
Traffic Watch allows you to observe incoming HTTP requests in real time. It shows which operations clients are performing and how often those requests reach the server. By watching this stream of activity, you can identify unusual request patterns or operations that may be putting pressure on the database.
If something is wrong and requests hit the database repeatedly every second it might be generating problems. RavenDB can also highlight HTTP requests that generate error codes like 4xx or 5xx.
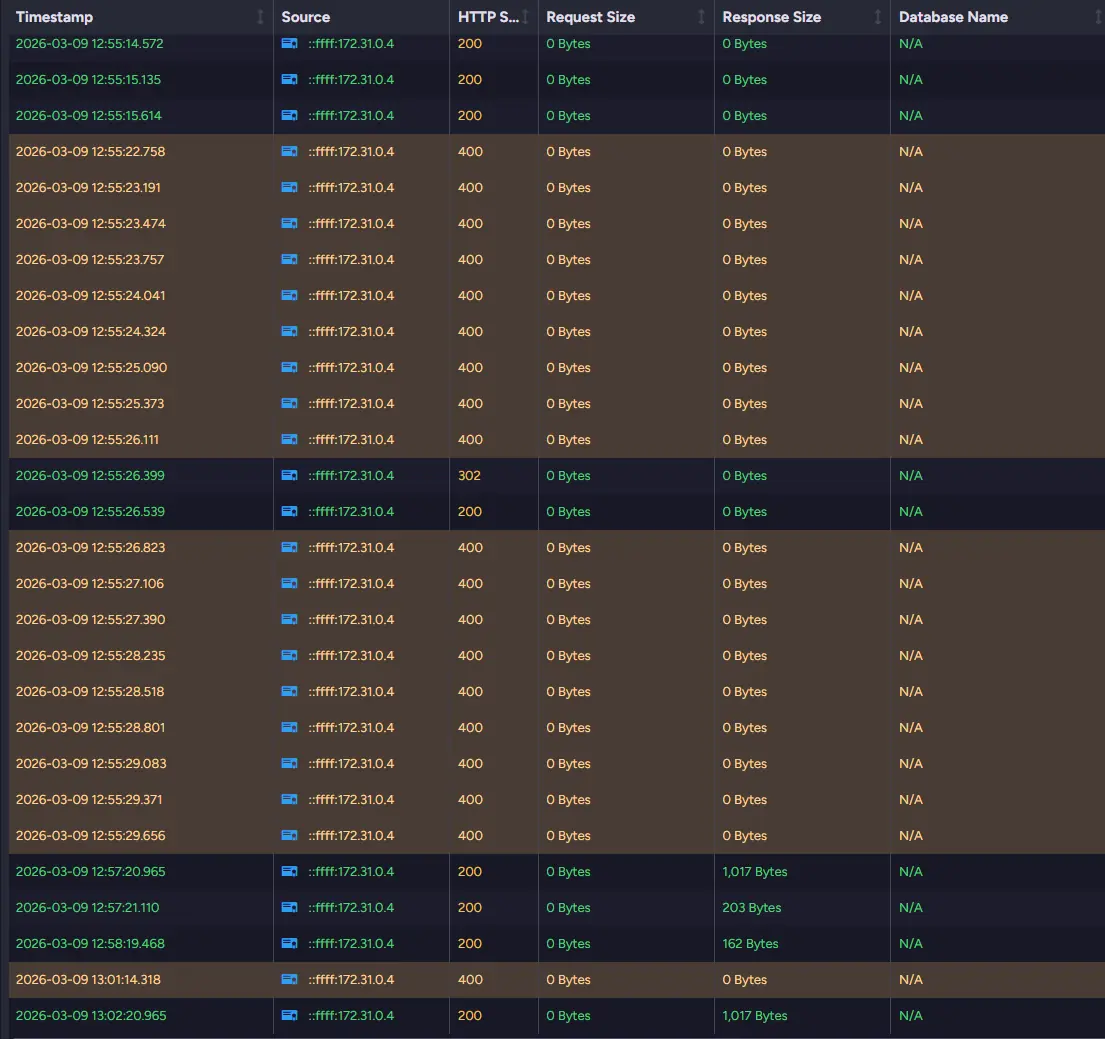
You can also see the request and response sizes for those requests. If those are significant and appear multiple times, they can affect your system. If you need even more information, you can look into Admin Logs instead.
If you want, you can also save Traffic Watch onto a disk, but it might result in a slight performance change. More about Traffic Watch, you can read What Requests Hit My Cloud Cluster.
Admin Logs
What it shows:
- Internal server activity, background tasks, and detailed log entries
Problems it identifies:
- Errors and exceptions inside the server
- Resource-heavy operations
- Hidden issues not visible in metrics e.g., background task you didn’t notice
Some problems happen deeper inside the server and are not visible through metrics. Internal tasks, background processes, or unexpected errors may leave their traces only in the logs.
Admin Logs provide detailed information about what the database is doing internally. By reviewing them, you can observe server activity and identify operations that may be consuming unusually high amounts of resources. So if your query sometimes doesn’t respond and Traffic Watch doesn’t give you enough information, Admin Logs are a great place to check.
In addition to performance-related information, the logs can reveal errors, warnings, or unexpected behavior that might not immediately appear in the UI. This makes them especially useful when you don’t know exactly what happened in the database that caused the issue. It is also a useful tool if you need to check later what led to problems, as you can download your logs to the disk after setup.
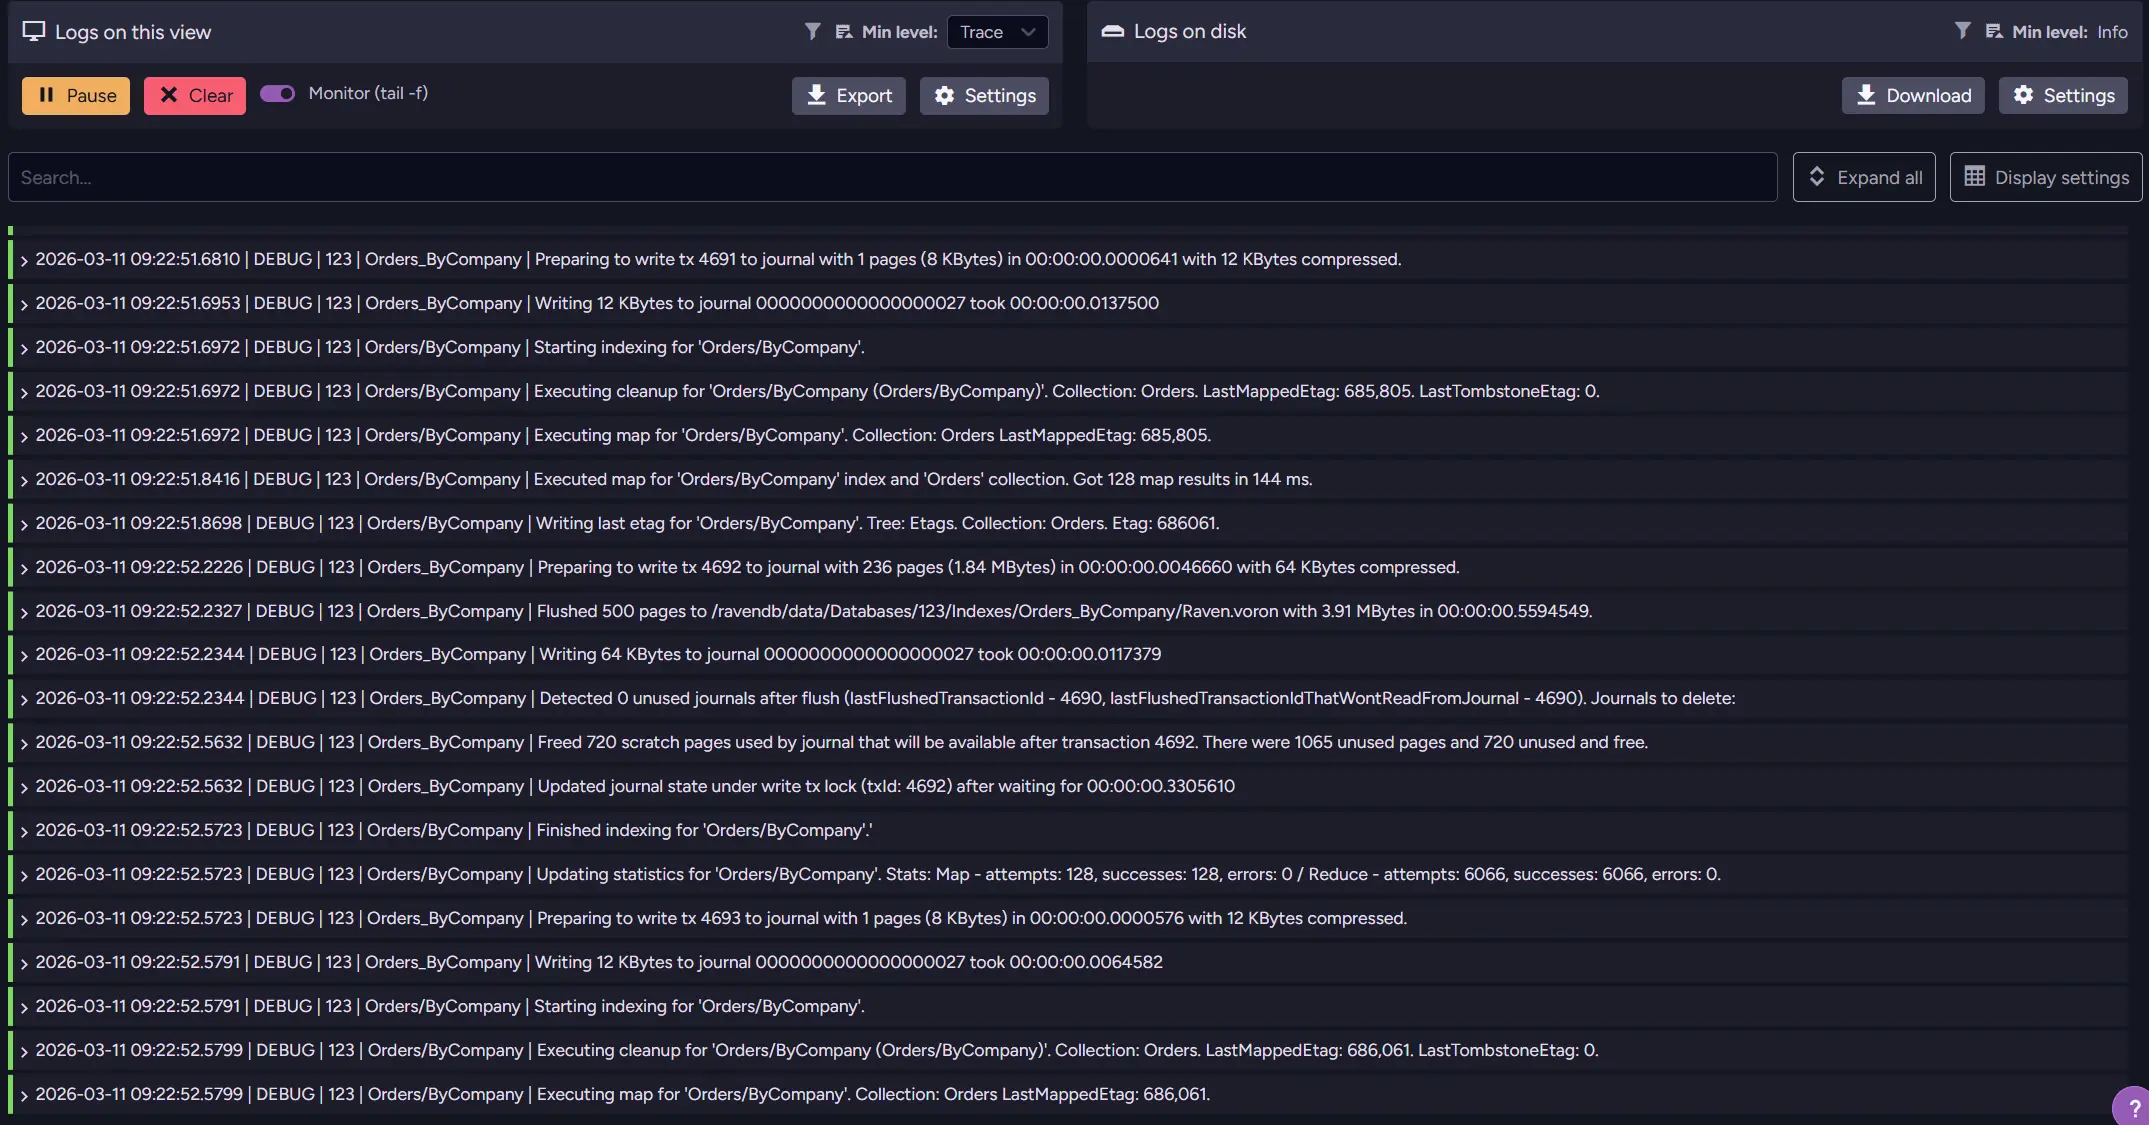
While logs require more careful reading than dashboards or metrics, they often contain the most precise description of what the server is actually doing at a given moment. Because it’s so detailed, it can be overwhelming and make it harder for less experienced users to pick out what actually matters. More about Admin Logs can be found in the What Requests Hit My Cloud Cluster article.
You can also send logs to outside monitoring like Grafana or Zabbix. They allow you to set up alerts, correlate metrics, and gather other useful information in one place. If you want to learn more about external monitoring, you can look into the External Monitoring section of this guide.
Cluster Debug
What it shows:
- Raft command flow and synchronization state between nodes
Problems it identifies:
- Connection issues between nodes
- Stuck or blocked cluster commands
- Synchronization issues affecting cluster consistency
More complex issues sometimes involve cluster coordination itself. Problems with Raft commands or with node synchronization can block certain operations. It is second only to Cluster Status in exposing those problems.
Cluster Debug exposes internal information about the cluster's state and Raft command queue. It can help identify nodes that are behind or situations where cluster commands are stuck. For example, if you post many commands at once, such as inserting files with operations, you can cause desynchronisation between nodes.
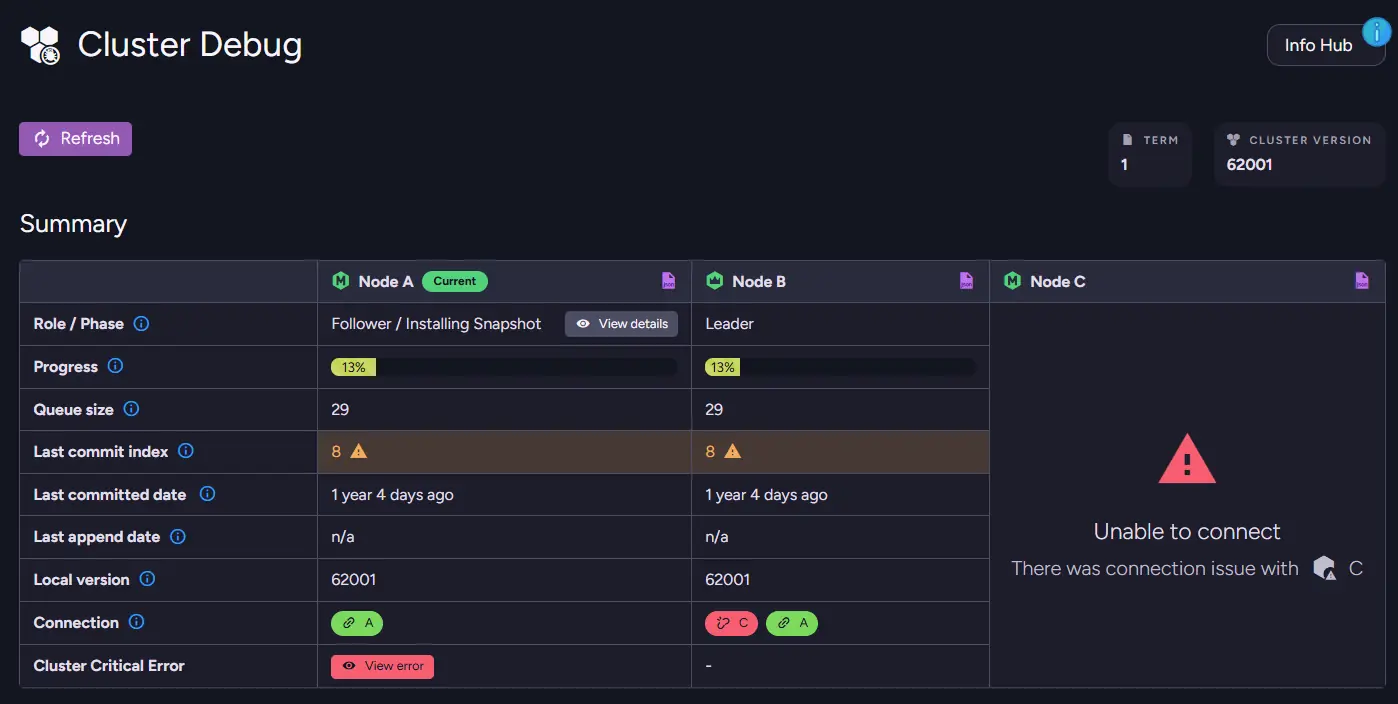
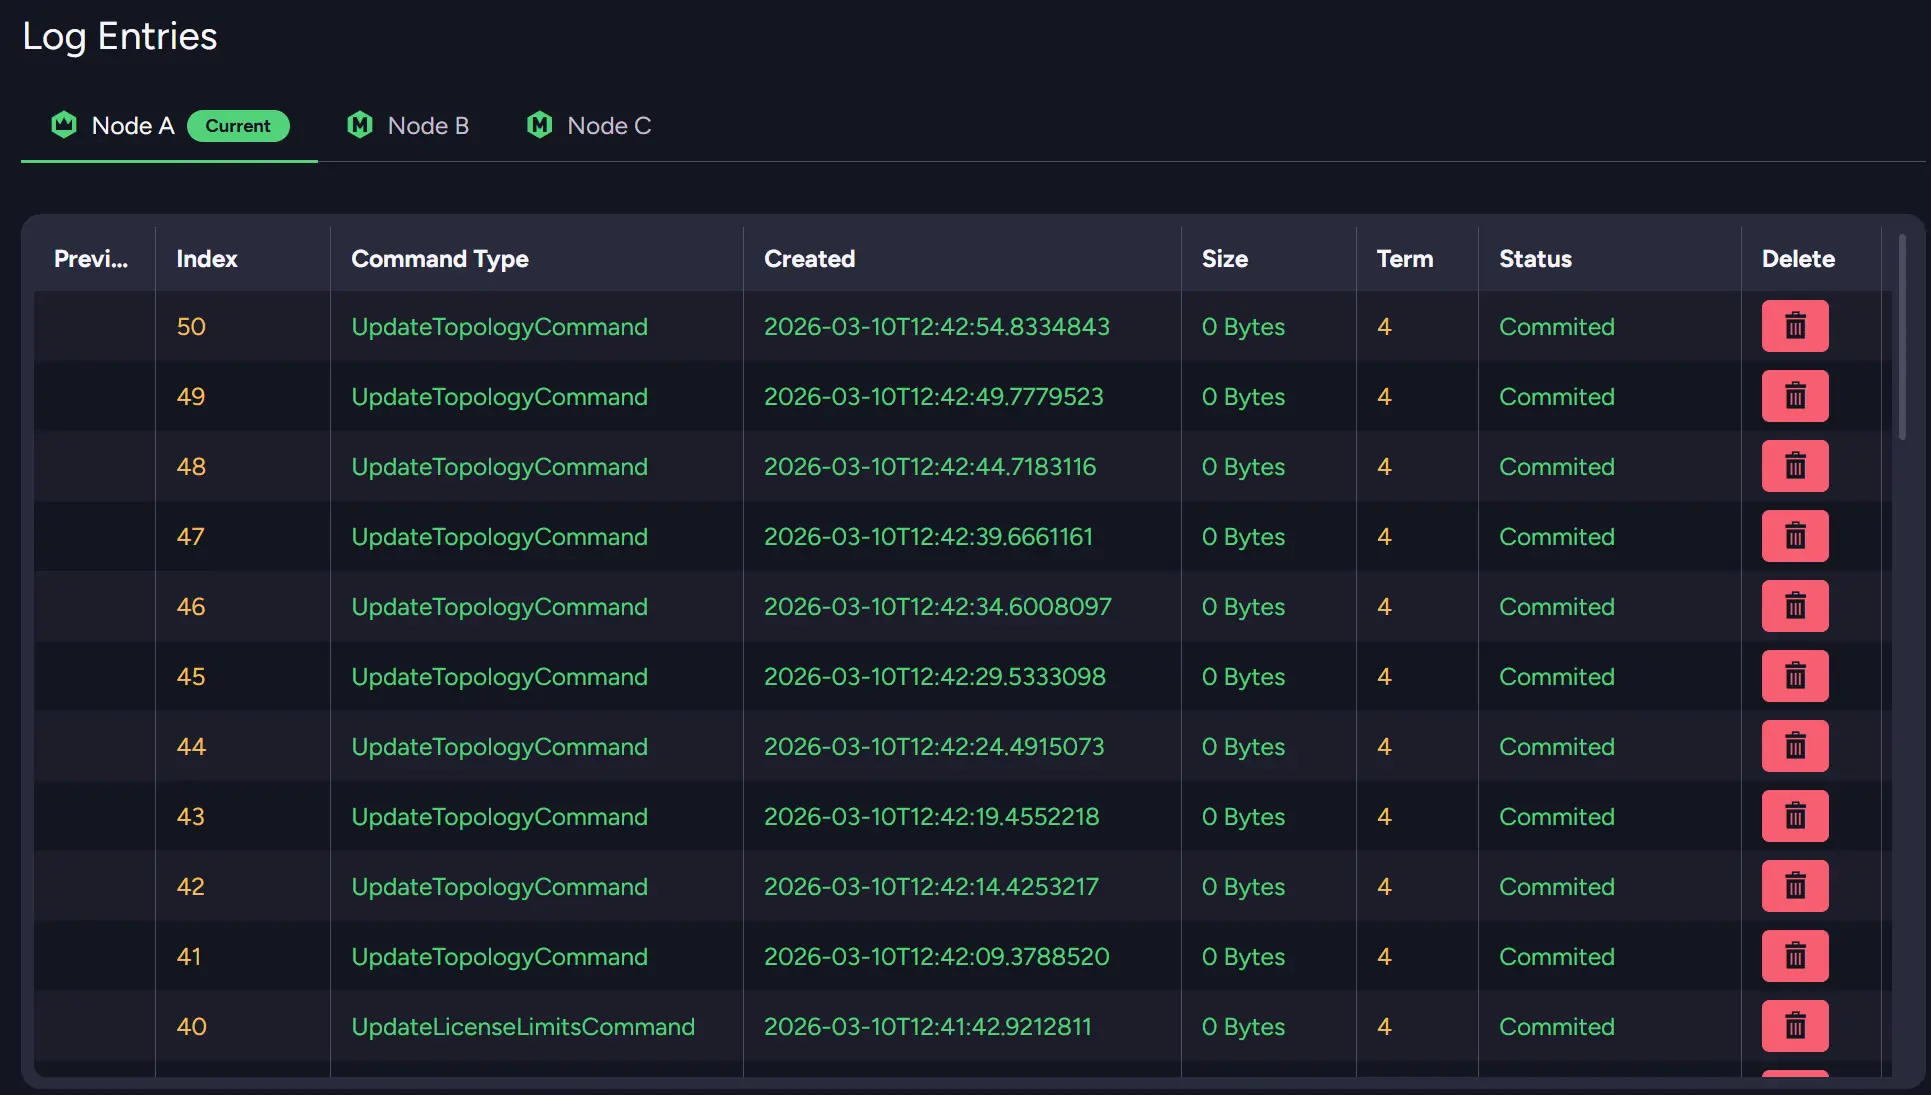
You can also see the queue size for each node to see if it’s desynchronized or see the status of your nodes. Scrolling down, you can also see the whole log entry for Raft operations that happen on each node.
RavenDB Cloud Alerts and Metrics
What it shows:
- Instance health and cloud-specific monitoring insights
Problems it identifies:
- Degraded instance health
- Resource bottlenecks in cloud environments
- Issues flagged with suggested actions
If you are using RavenDB Cloud, it also provides its own basic monitoring for all users. Instance changes or resource limits that can affect the performance of your deployment.
The first part of RavenDB Cloud monitoring is the Metrics and Cluster Health screens. The first metric you might look at to notice a problem is Nodes Availability widget. It is placed on the Cluster Health screen and provides overall information about whether something is wrong. If it is degraded, it’s a first alarm to look deeper into the system.
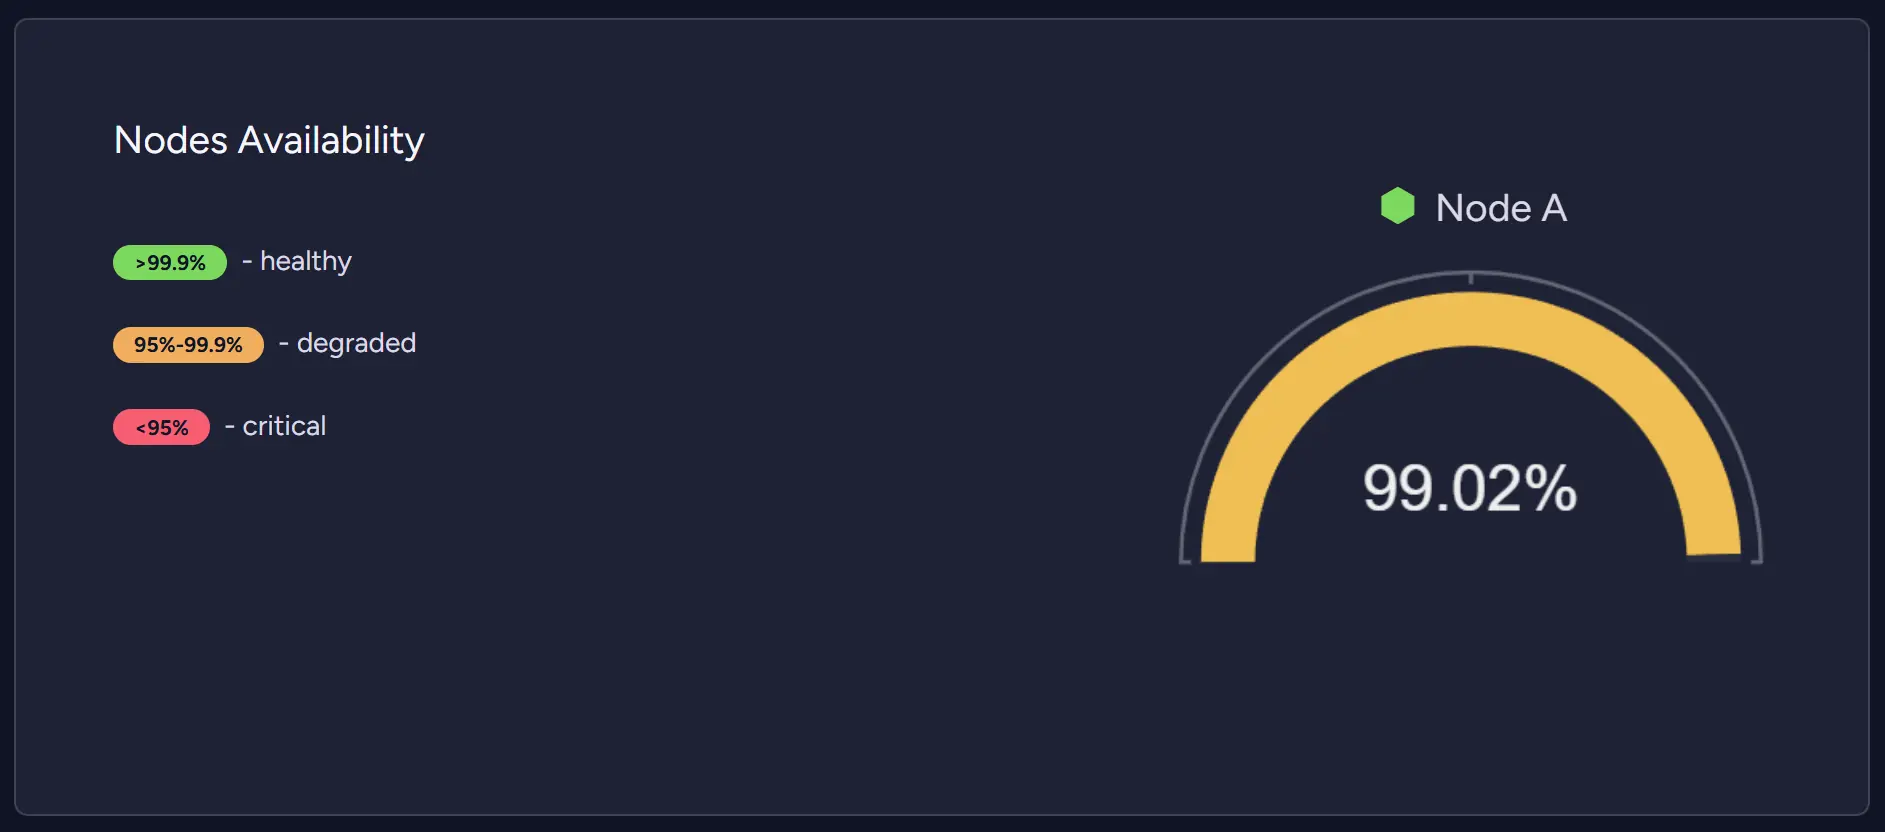
Then you can look into metrics, suggestions, and incident history to determine the problem. When we look into our test database, we can see it degraded only a bit, but we will look into the problems either way.
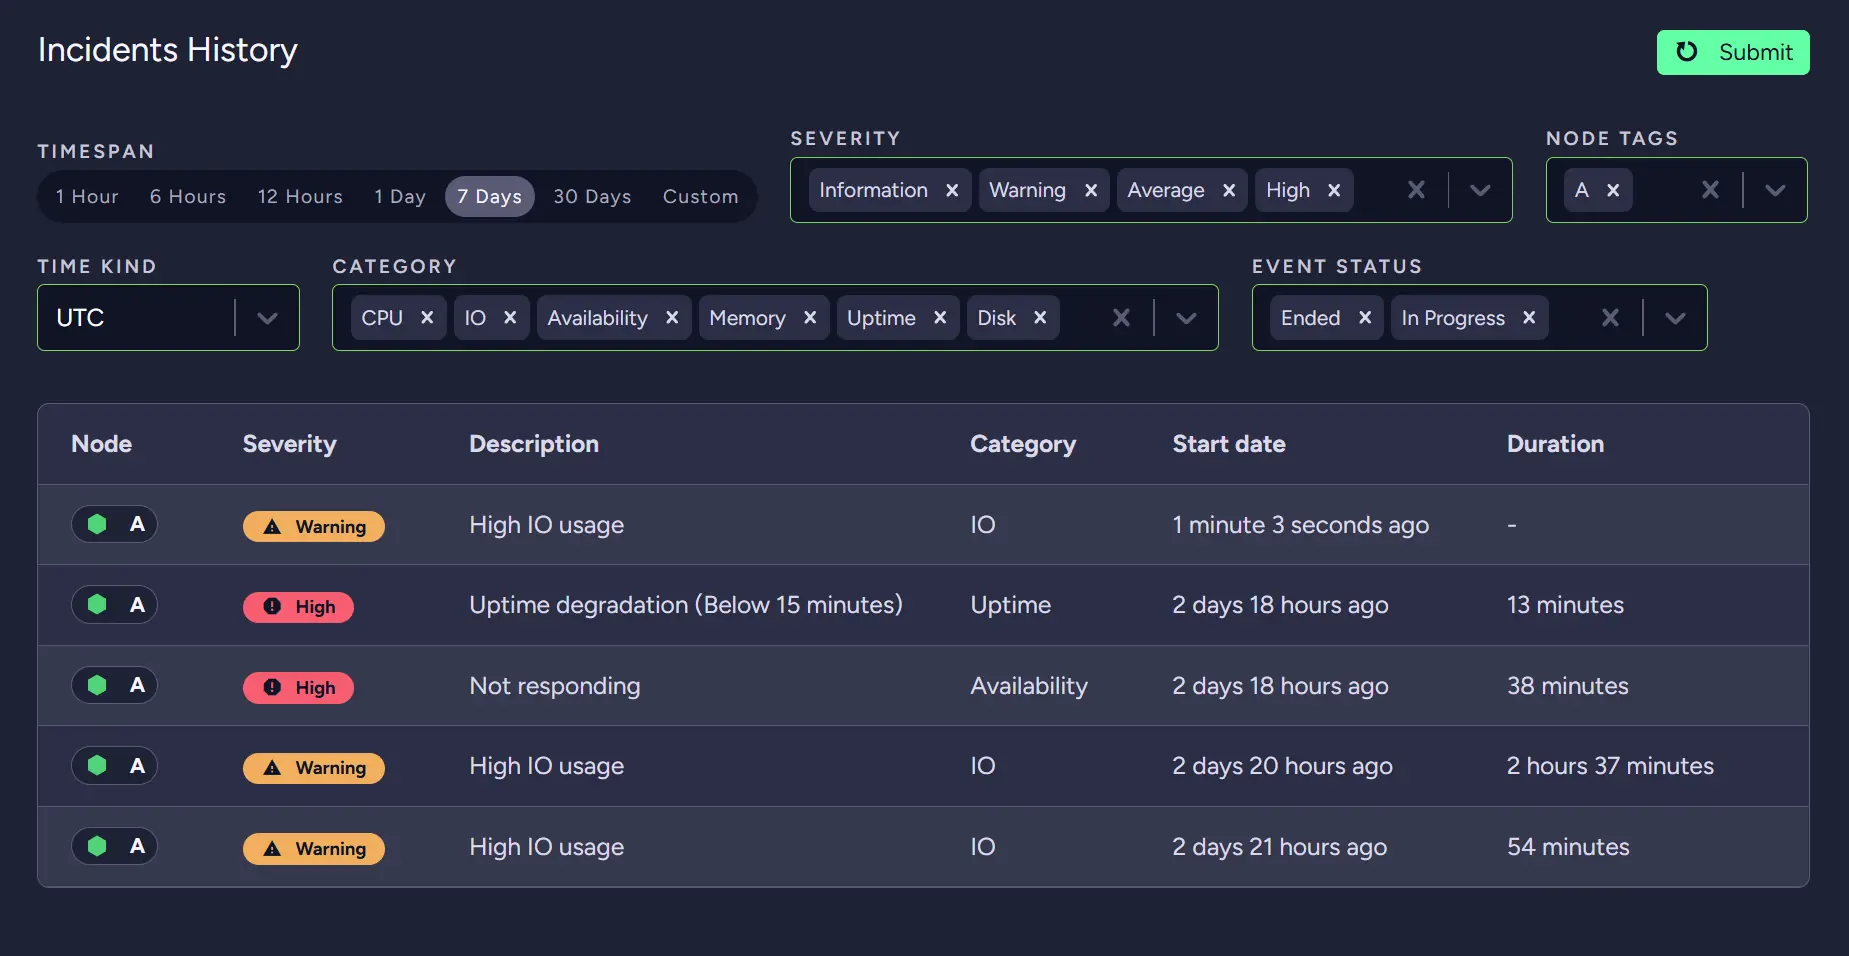
While looking at the incident history, we can see that our problem is High IO usage. By looking further into suggestions, we can see that we should consider upgrading our instance.
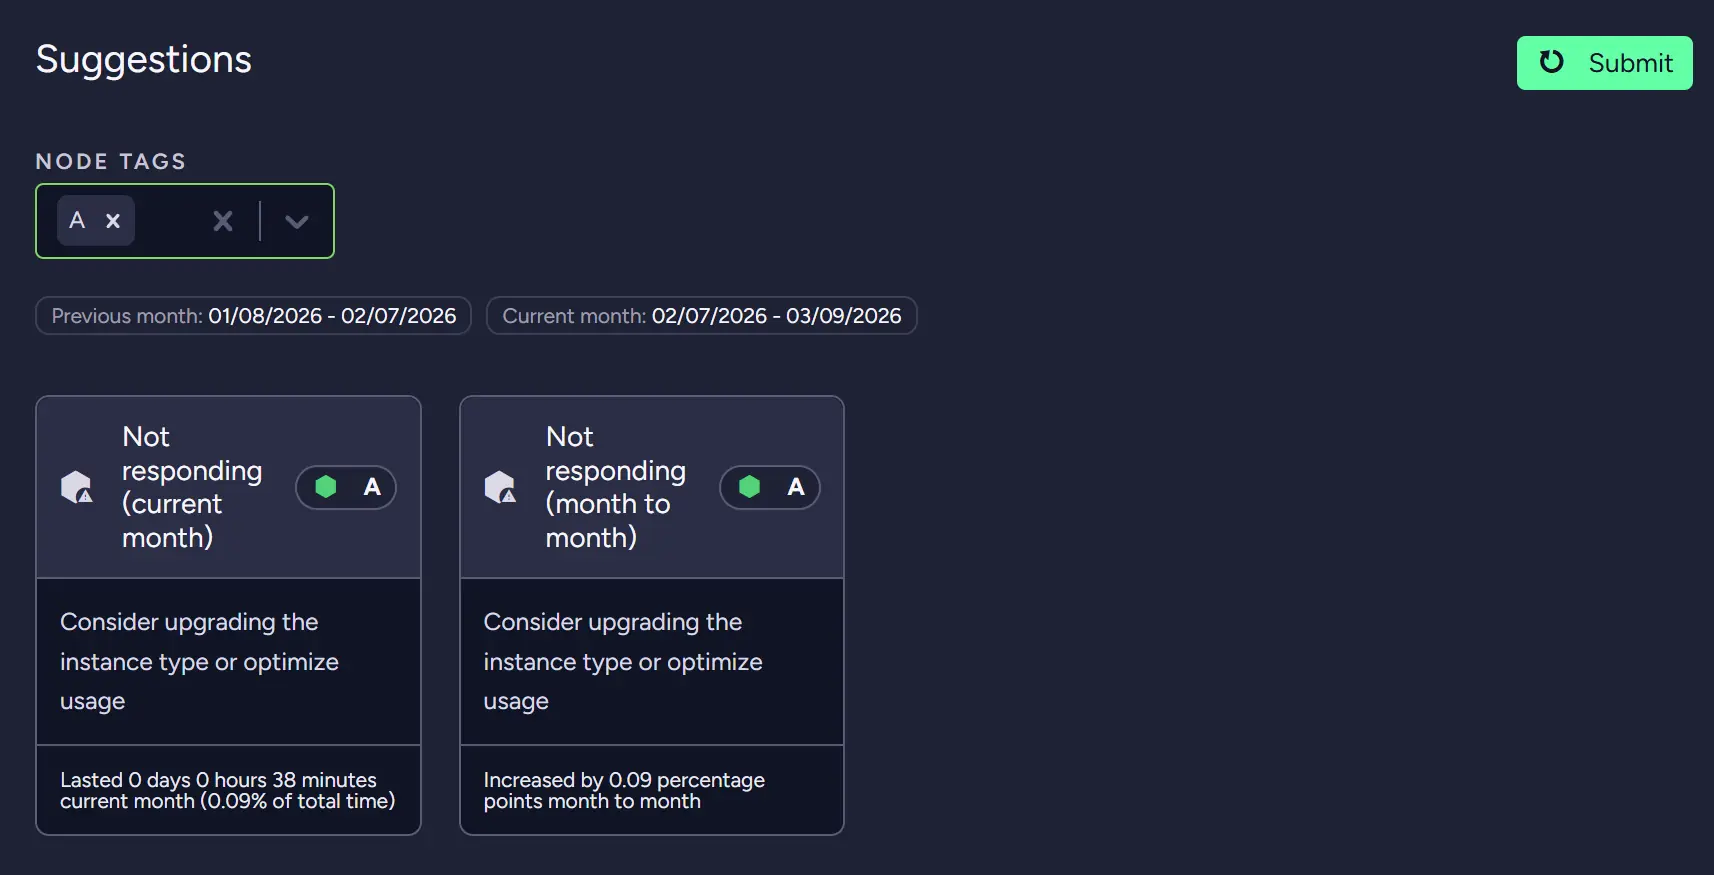
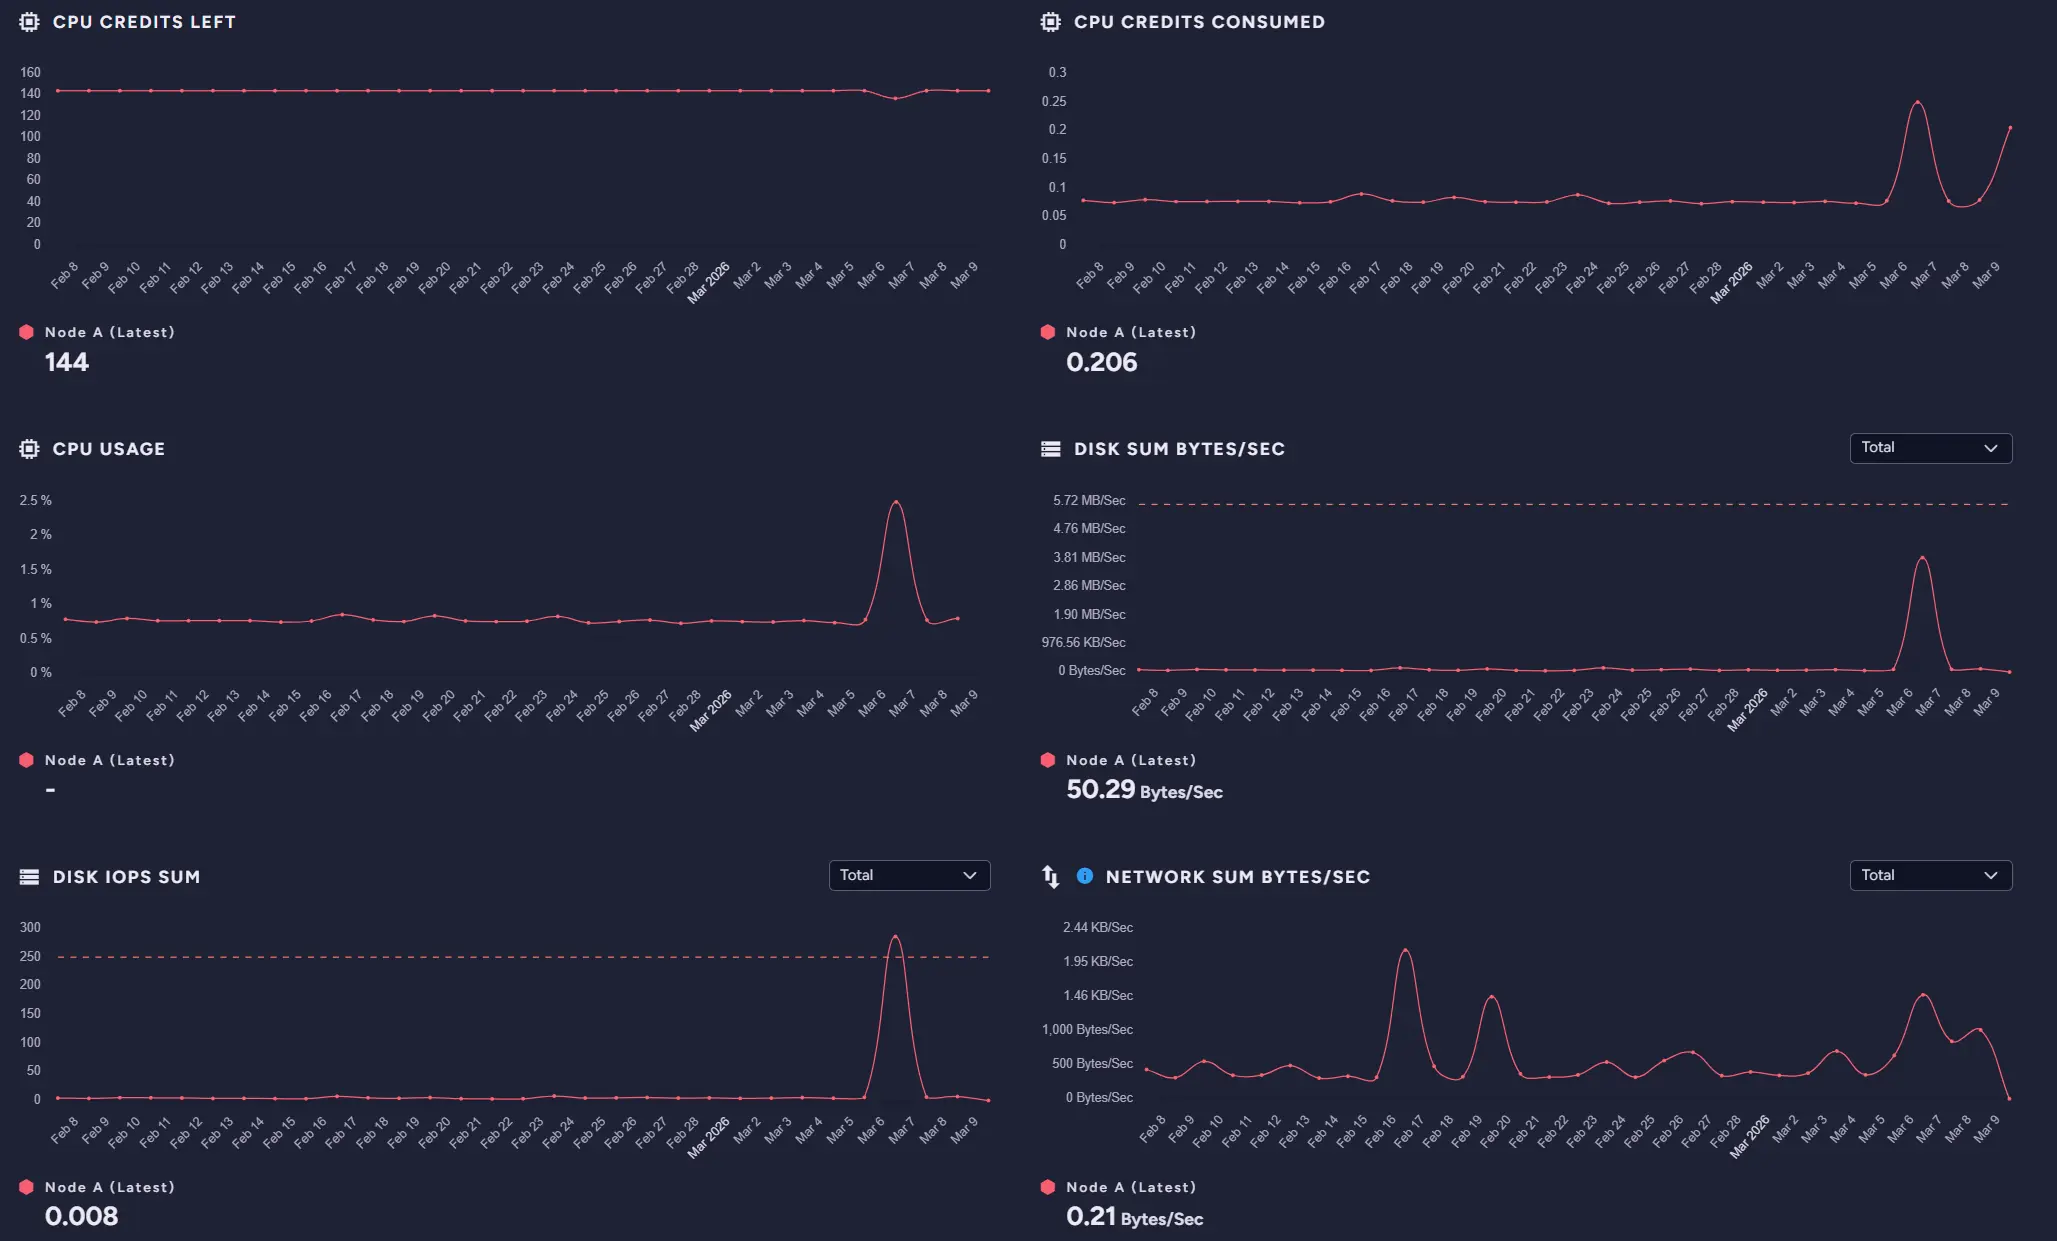
To determine whether we want to proceed, we can go into the Metrics screen and review them to see whether we really need to upgrade. In our case, the database was calm most of the time, so depending on whether it will be a recurring problem, we can upgrade or check whether our systems aren’t generating such high I/O usage in a different place. Either way, we know that we now need to look into IO.
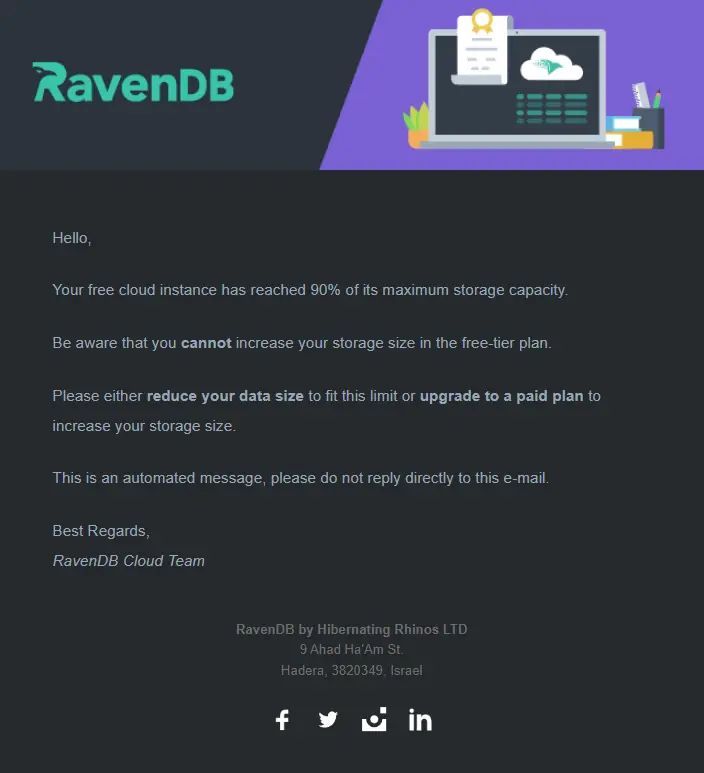
Additionally, if the database is struggling and, for example, our problems will start to fill our instance with data, or it will auto scale, we will get a notification via email connected to this database.
External Monitoring
What it shows:
- Long-term metrics, trends, and historical system behavior
Problems it identifies:
- Recurring performance issues
- Gradual degradation over time
- Patterns not visible in short-term diagnostics
This option is more about preventing future problems than about already existing ones. It is that way because external monitoring, as the name suggests, is external, so it needs to be set up before an incident. For RavenDB, we have two monitoring setup guides: Zabbix and Grafana.
As we said, it’s about preventing future problems. External monitoring can help you set up alarms and dashboards to detect potential problems before they become actual issues. Native RavenDB mechanisms are good until you need long-term logs and dashboards that require customization.
For example, if we receive reports of problems at certain hours, we can check the monitoring to investigate the issue later. Without it, we would need to dig into logs to just know something is wrong, or be there during problems to notice what isn’t really a realistic scenario. Worst-case scenario, you might not even know something is wrong for days. Meanwhile, with monitoring, we can sit down after an incident or even be notified and look at what is wrong. It’s basically a dashboard, but allows for more customisation.
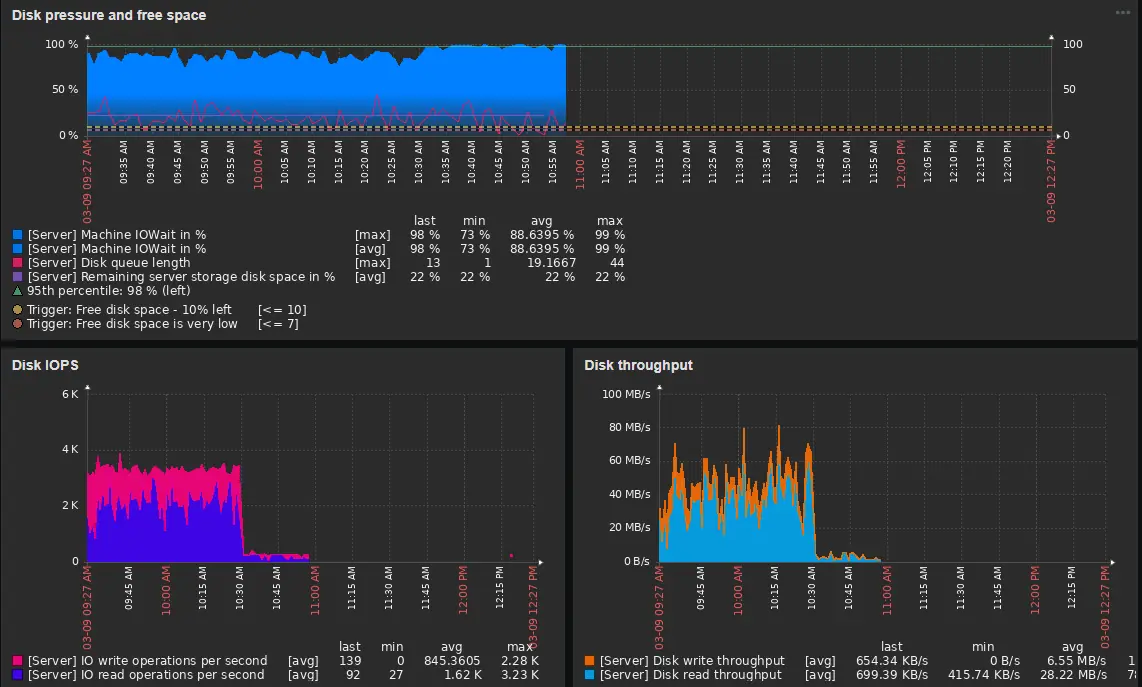
In our case, the disk is under the most pressure. Now we have a lead, and we can go to the database and use previous tools to identify the cause. More about monitoring can be found in the articles we mentioned.
Now that you know where to look, you might need a way to fix your problems or look even deeper into them. If you need help with investigating high CPU usage, you may be interested in How to Troubleshoot High CPU Usage in RavenDB. Or maybe you are having trouble with high memory usage; we have a guide on troubleshooting high memory usage in RavenDB, too.
Interested in RavenDB? Grab the developer license for testing, or get a free RavenDB Cloud database. If you have questions about this feature, or want to hang out and talk with the RavenDB team, join the RavenDB Discord Community Server.