Increase your RavenDB observability with Grafana Cloud and OpenTelemetry

What you will learn
- How to enable OpenTelemetry in RavenDB
- How to connect your RavenDB to Grafana Cloud
- How to create basic visualization in Grafana Cloud
Introduction
Increasing your system's observability is often much appreciated, but setting up database monitoring can become complex. That’s why, in this article, we’ll precisely guide you through setting up OpenTelemetry to use RavenDB with Grafana Cloud. This will allow you to create pretty dashboards that visualize metrics seamlessly.
OpenTelemetry is a collection of APIs, SDKs, and tools. RavenDB uses it to instrument, generate, collect, and export telemetry data (metrics, logs, and traces) to help you analyze its performance and behavior. See the OpenTelemetry support documentation for the full list of meters RavenDB exposes.
Feature availability
OpenTelemetry is available on RavenDB Cloud for RavenDB 6.2 and newer. Cloud instances are
configured from the portal rather than settings.json: on the Monitoring feature row click
Configure, then use the OpenTelemetry Configuration tab to select your meters and set the
destination. Enabling or disabling Monitoring requires the Manager (or Admin) preset together
with the Security admin add-on. See
Cloud product features for details.
The rest of this guide covers the self-hosted path through settings.json.
Prerequisites
What you will need:
- Grafana Cloud account
- RavenDB cluster with database
RavenDB database
Before connecting RavenDB to Grafana, ensure your RavenDB cluster is running. To learn more about installation, see the RavenDB Setup Wizard documentation.
Download RavenDB from its website, extract it, and launch Raven.Server.exe or from the server directory. Once the terminal generates a URL, open it in your browser, accept the EULA, and create a new cluster. Choose your security level, proceed with the setup, and click "Finish" unless you have specific requirements.
Grafana Cloud account
With a RavenDB server ready, you will also need a Grafana Cloud account. To create an account, go to the Grafana website and select the ‘Create Account’ button. You want to fill in your E-mail and password or use one of the other sign-in options.
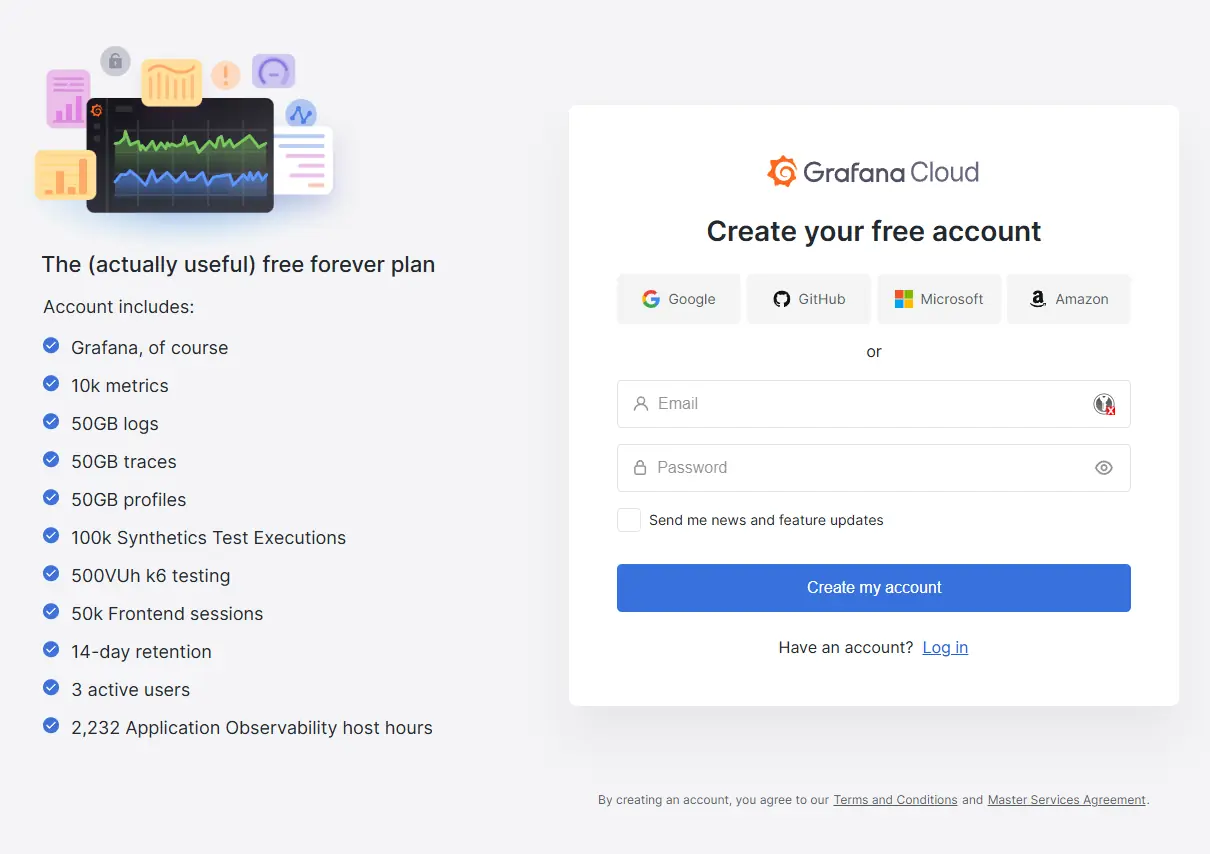
Now, you must choose your stack URL and deployment region, which should be as close to your RavenDB server as possible. Once you’ve completed this, let’s begin configuring your Grafana.
Setup
Getting stuff from Grafana: the OTLP endpoint and API token
Now that you have prepared everything you need (Grafana Cloud account and RavenDB database server), it’s time to connect everything. First, let’s skip templates. No template can help in our case. Select ‘I’m already familiar with Grafana. Skip Setup’ at the bottom of the setup window.
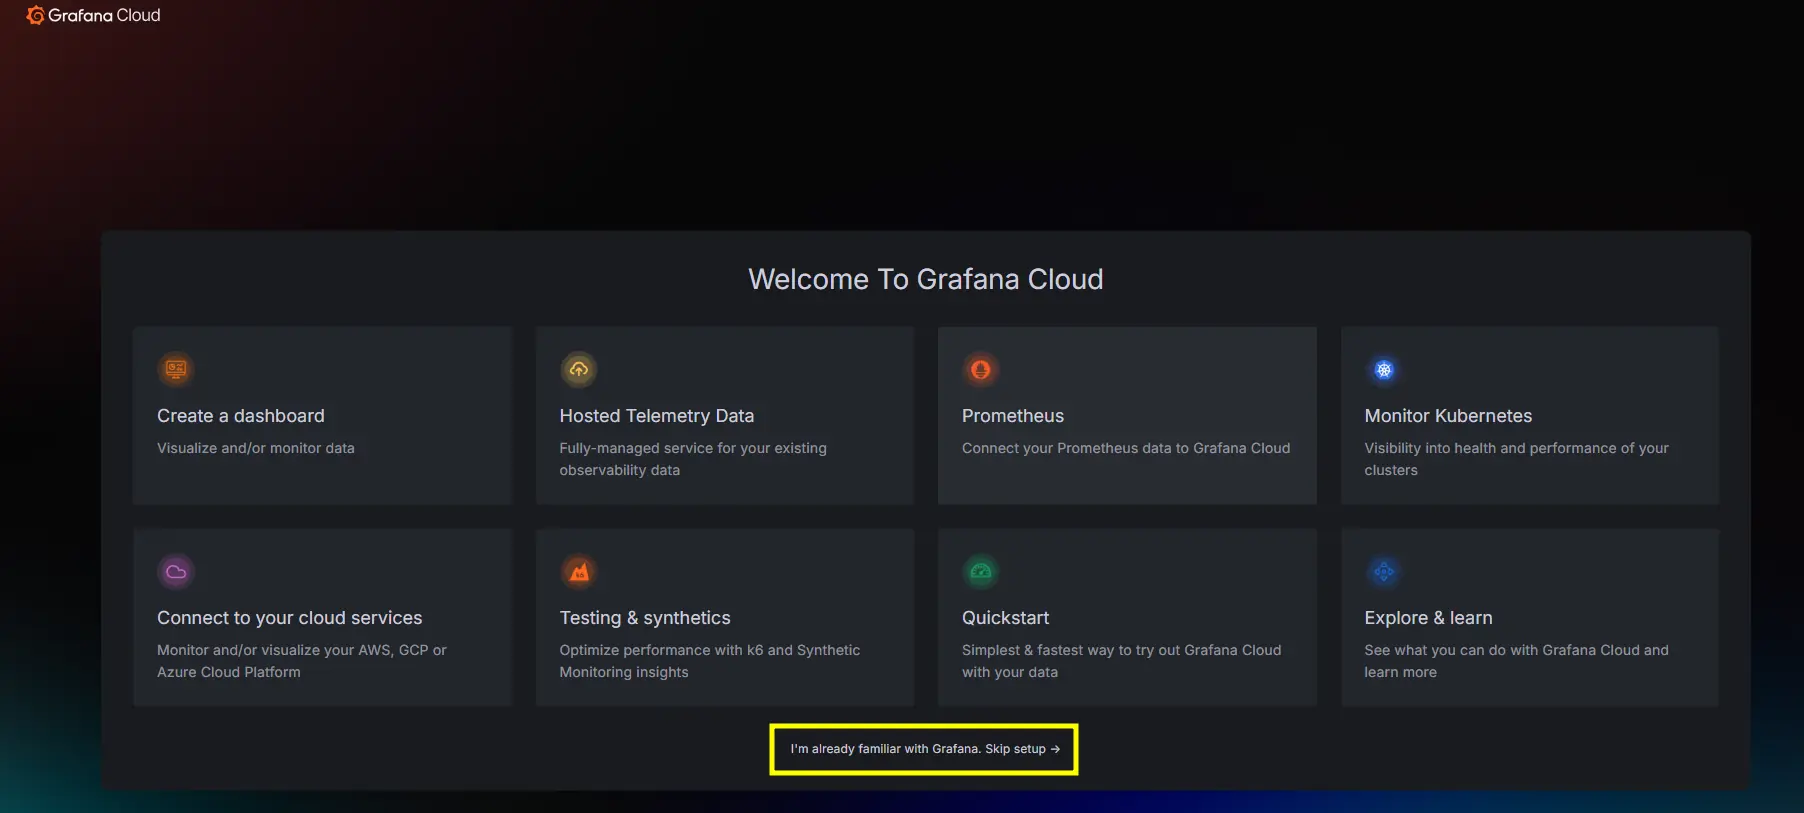
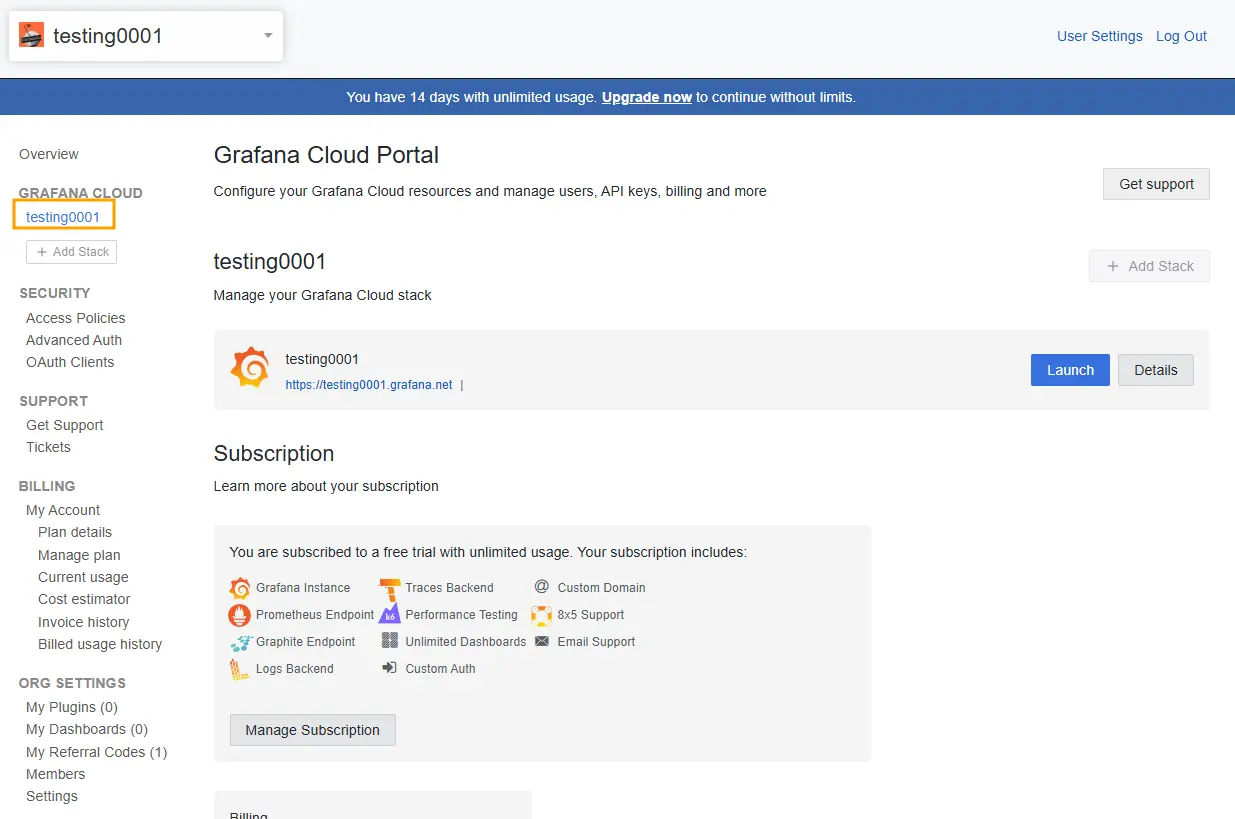
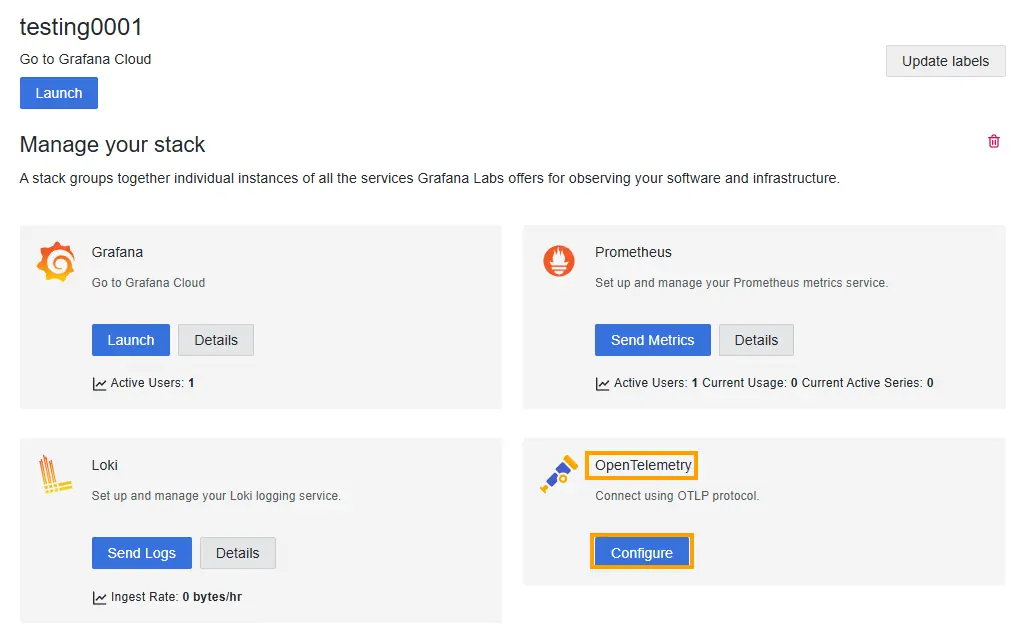
Next, on your home page, choose ‘Add users.’ That will take you to the Grafana Cloud panel, where you will get all the needed options. On the left side, under Grafana Cloud, click on your domain name. On the list, find OpenTelemetry and click ‘Configure’.
Putting things into settings.json: enabling the OTLP exporter
Once you are on the OpenTelemetry configuration page, we can start setting up your connection. In your RavenDB directory, open the ‘Server’ directory and open ‘settings.json’. You need to turn on OpenTelemetry. To do that, paste the following code inside existing brackets:
  "Monitoring.OpenTelemetry.Enabled": true,
  "Monitoring.OpenTelemetry.OpenTelemetryProtocol.Headers": "Authorization=Basic SPACE_FOR_YOUR_TOKEN",
  "Monitoring.OpenTelemetry.OpenTelemetryProtocol.Endpoint": "https://otlp-gateway-prod-your-region.grafana.net/otlp/v1/metrics",
  "Monitoring.OpenTelemetry.OpenTelemetryProtocol.Protocol": "HttpProtobuf",
Every key used here is described in the monitoring integrations configuration reference.
Don’t close the window, we will return here later. Now, come back to Grafana. From the OpenTelemetry config, copy an endpoint that starts with:
https://otlp-gateway-prod-your-region.grafana.net/otlp
Instead of ‘your-region’, your Grafana Cloud server should have an endpoint region. After pasting it in settings into Monitoring.OpenTelemetry.OpenTelemetryProtocol.Endpoint append URL path /v1/metrics at the end so that it is like the following:
"Monitoring.OpenTelemetry.OpenTelemetryProtocol.Endpoint": "https://otlp-gateway-prod-your-region.grafana.net/otlp/v1/metrics",
Afterward, go back to your Grafana and find ‘Password / API Token’ where you want to click ‘Generate now’ placed next to it. In the popup window, choose your token name and click the ‘Create token’ button.
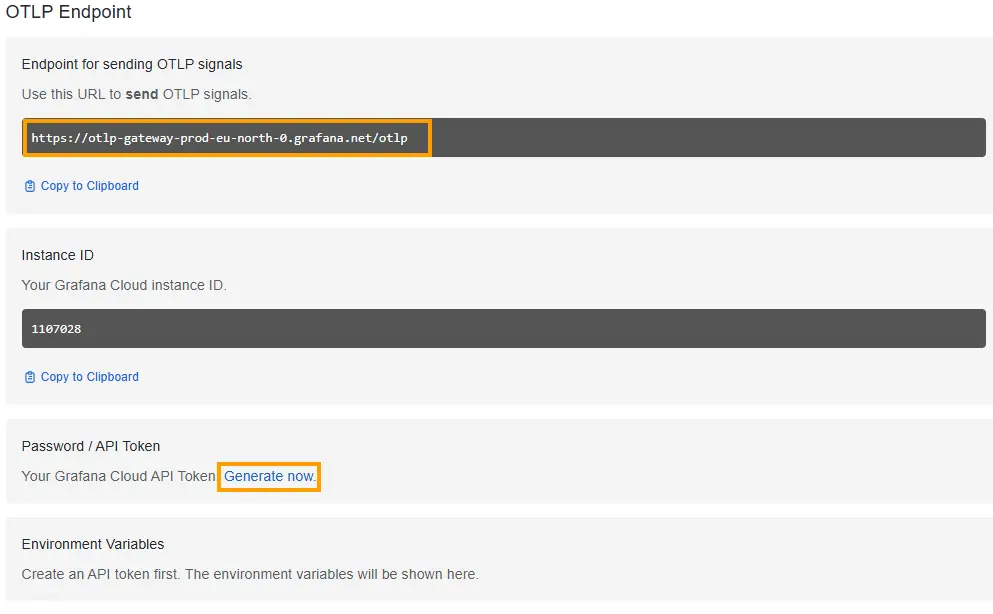
After it generates your token, you can close this popup and look under it in the ‘Environment Variables’ section. There, you want to copy the key starting with ‘Authorization=Basic’ and paste it into ‘"Monitoring.OpenTelemetry.OpenTelemetryProtocol.Headers":’ So it looks similar to that:
"Monitoring.OpenTelemetry.OpenTelemetryProtocol.Headers": "Authorization=Basic MTEwMTcwOTpnbGN...4ta="
Then you can add some code below HttpProtobuf. They enable a few non-default options:
  "Monitoring.OpenTelemetry.Meters.AspNetCore.Enabled": true,
  "Monitoring.OpenTelemetry.Meters.Runtime.Enabled": true,
  "Monitoring.OpenTelemetry.Meters.Server.GC.Enabled": true
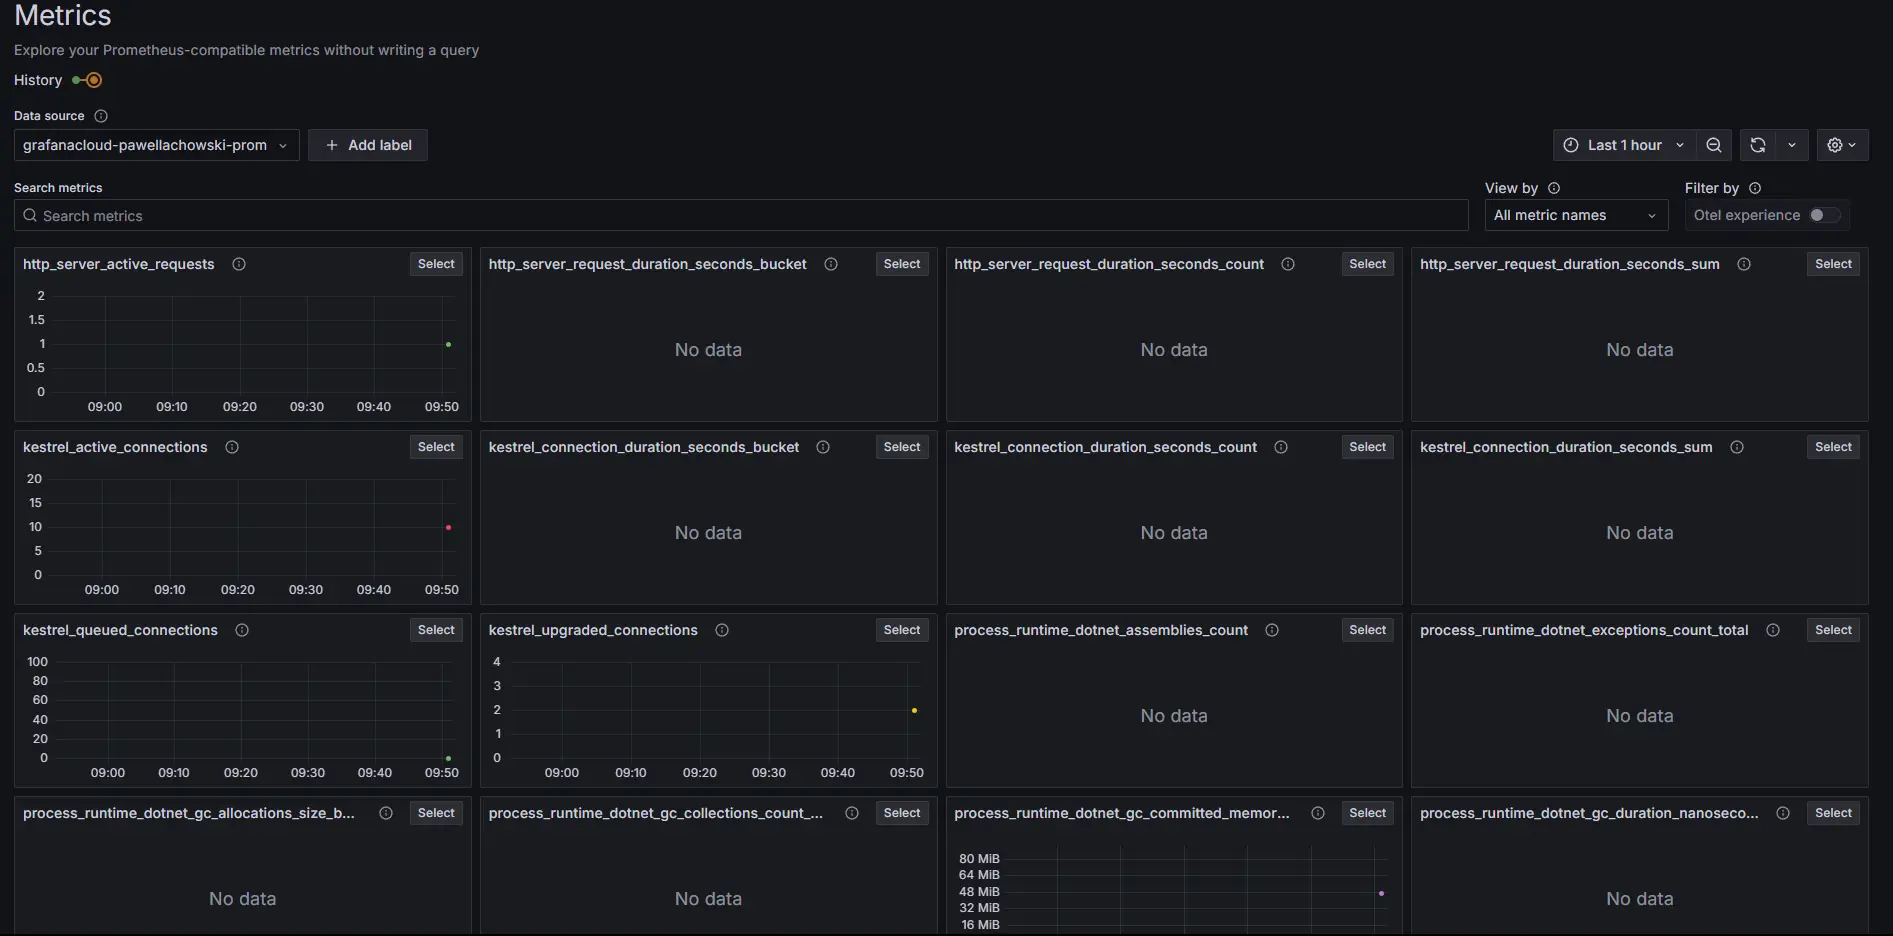
After pasting your token, save your settings.json and restart the RavenDB server. Returning to your web browser, you can go to the Grafana Cloud panel and choose launch under Grafana. This will let you go back to your home page. To check the connection, unfold ‘Explore’ on the left bar, then ‘Metrics’, and click ‘Let’s start!’. You should see available metrics there. If you don’t see any metrics immediately, it is possible that your server hasn’t sent any data yet. RavenDB sends OpenTelemetry data once a minute, so you need to be patient. Such metrics should look like this.
Creating the CPU Dashboard
We’ve successfully connected. Let’s make a simple one-metric dashboard.
Open the left bar again and click on the ‘Dashboards’ section. Then, on this site's right side, click ‘New’ and choose ‘New dashboard’. Next, you want to ‘Add visualization’ and choose grafanacloud with your stack name and default tag.
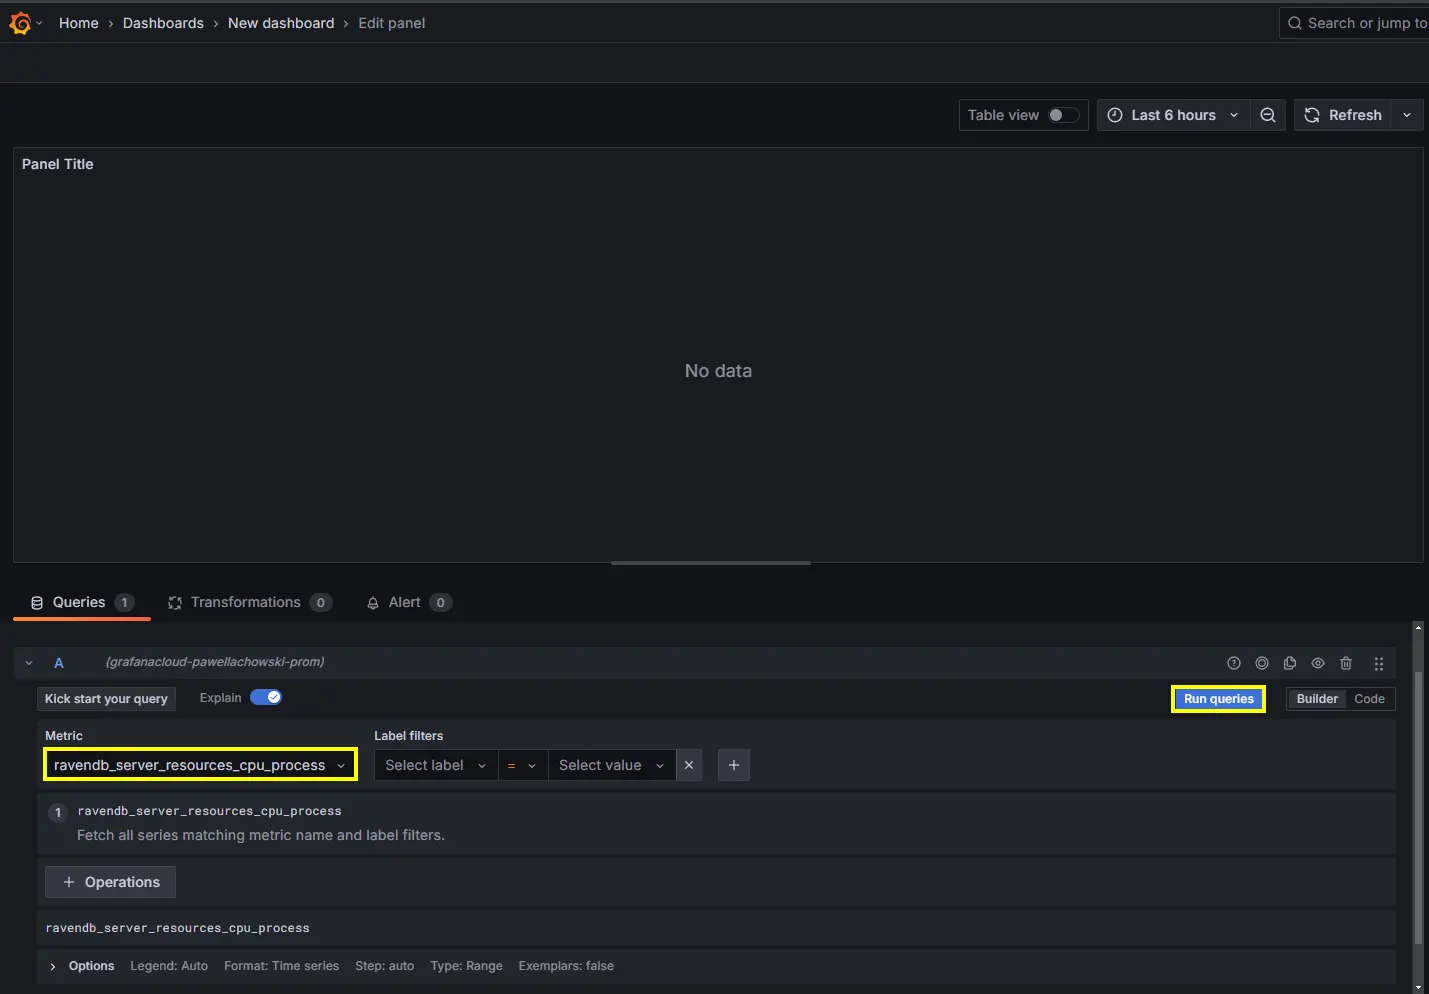
Now, you have many options and probably don’t know where to start. First, let’s add a new metric. The option to do that is on the bottom bar. Click on ‘Select metric’ and search for CPU. Then scroll down to the bottom of the list and select ‘ravendb_server_resources_cpu_process’. After selecting this, you need to press the ‘Run queries’ button, which should show you a chart (can be a straight line).
You have your first metric, but let’s add more finishing touches. On the right bar, change the title to ‘Current CPU usage %’.

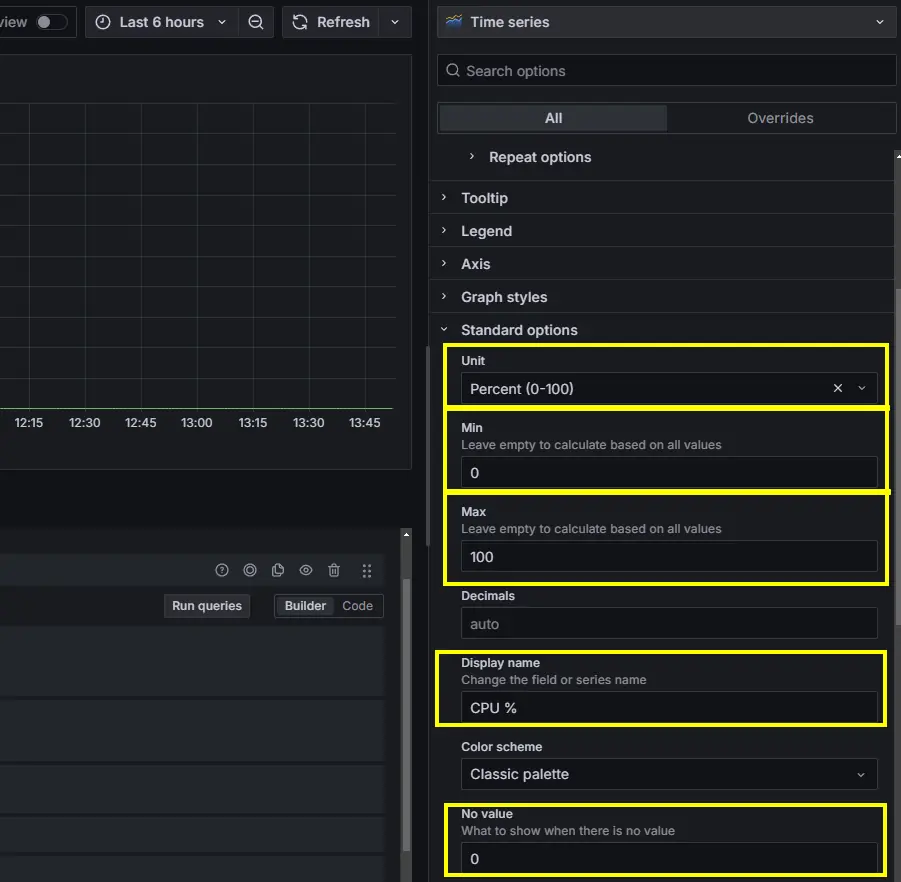
Next, scroll down lower until you find standard options. Choose ‘Misc’ and ‘Percent (0-100)’ in the' Unit' options. If you look lower, you can see the Min and Max options. You should set the Minimum to 0 and the Maximum to 100. You can also change the ‘Display name’ that you can find under Max. You should also set ‘No value’ to ‘0’ so your chart will know what to display if there is no data.
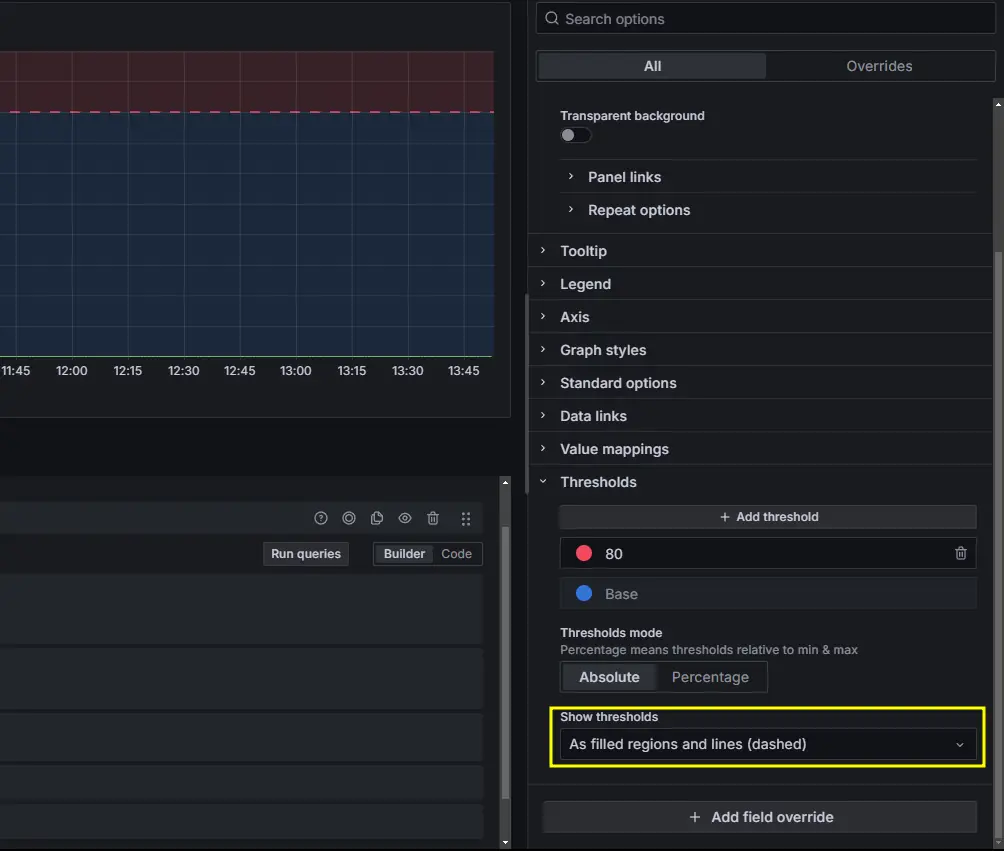
Next, you can scroll down to the threshold options and change “Show threshold” to ‘As filled regions and lines (dashed) to see when your usage goes above 80%.
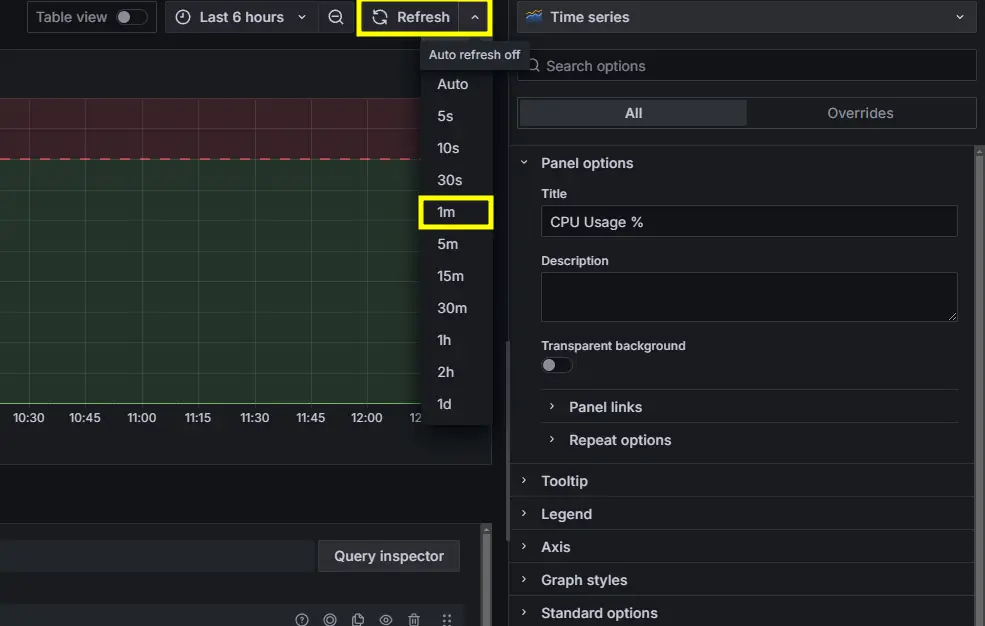
Once you have your visualization set, you need to change the manual refresh on top to 1m so it refreshes automatically every minute.
And that’s it. Your dashboard now has a functioning metric. You can save this visualization at the top right side of the window.
Summary
We prepared and connected your RavenDB database to the Grafana cloud using OpenTelemetry and also created a basic visualization of CPU usage for your new dashboard. This increases database observability and can be broadly expanded to meet your needs.
If you want your server logs flowing into the same Grafana stack, see Sending Your RavenDB 7.0 Logs to Grafana Cloud.