The Package Told a Story: Diagnosing a Cluster You Can't Log Into

Diagnosing a cluster you can't log into
Sometimes, when diagnosing RavenDB issues, a debug package is all you have to work with. It’s self-contained and provides all necessary details into database health without spilling the production data. When a cluster is misbehaving, a customer or colleague sends you a .zip, but you have no direct access to the system itself: no console, no metrics dashboard, no endpoint to query. A RavenDB debug package is a snapshot of what the server knew about itself at the moment the package was created. It contains:
- Metrics
- Cluster state
- Database statistics and configuration
- Logs
It does not contain customer documents. Aside from database and index names, which are rarely sensitive, you can inspect it without handling private customer data. RavenDB has covered real support cases like this before under a useful rule: when debugging, assume an unreliable narrator.
The customer’s description is a hypothesis, not evidence. The debug package is much closer to evidence, but only when you know how to read it. This guide will show you how. Reading a package manually means opening JSON files and reconstructing the cluster’s state in your head. The Debug Package Analyzer does that work for you.
It is a server-side tool available through Studio. Studio only displays the results. The analysis itself runs on the server and requires nothing except the debug package, so you can investigate a cluster without connecting to it.
This guide is a panel-by-panel reference to the analyzer. It covers every panel in the three contexts the tool is organized around, Cluster, Node, and Database, with the tips and traps that matter when you read each one.
If you have a package open and a customer waiting, jump to the panel closest to your symptom. If you are here to learn the tool, read straight through. A diagnostic cheatsheet at the end gives you the symptom-to-panel shortcut for next time.
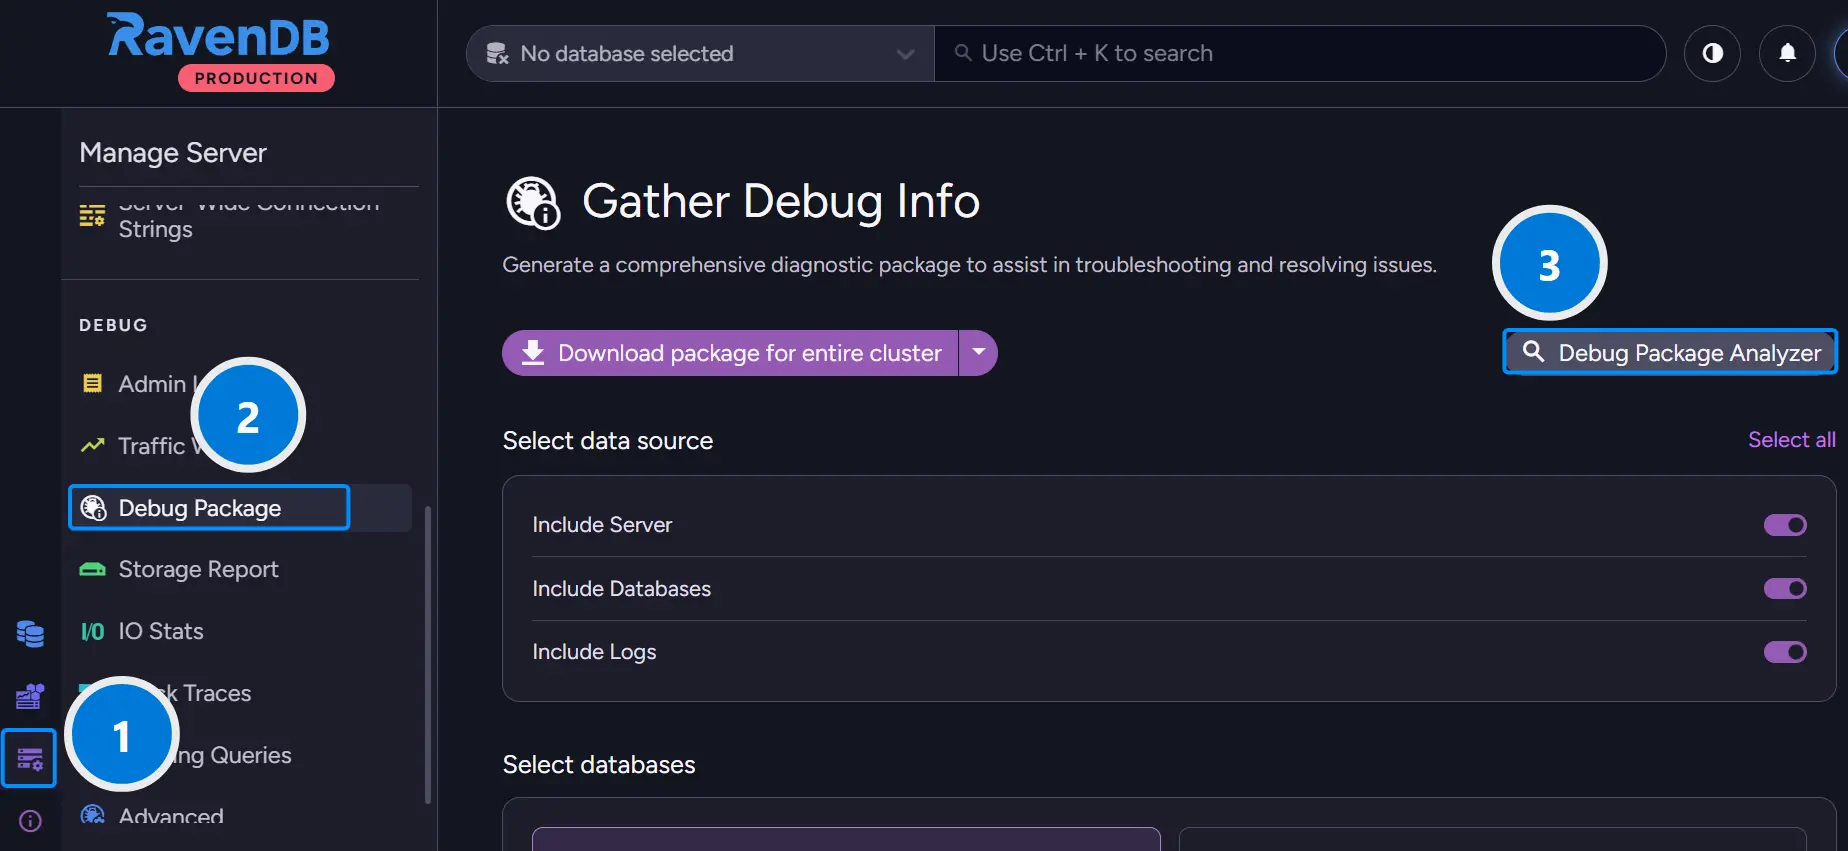
To open it:
- Go to Manage Server > Debug Package.
- Click Debug Package Analyzer.
- Drop the customer’s .zip file into the upload area.
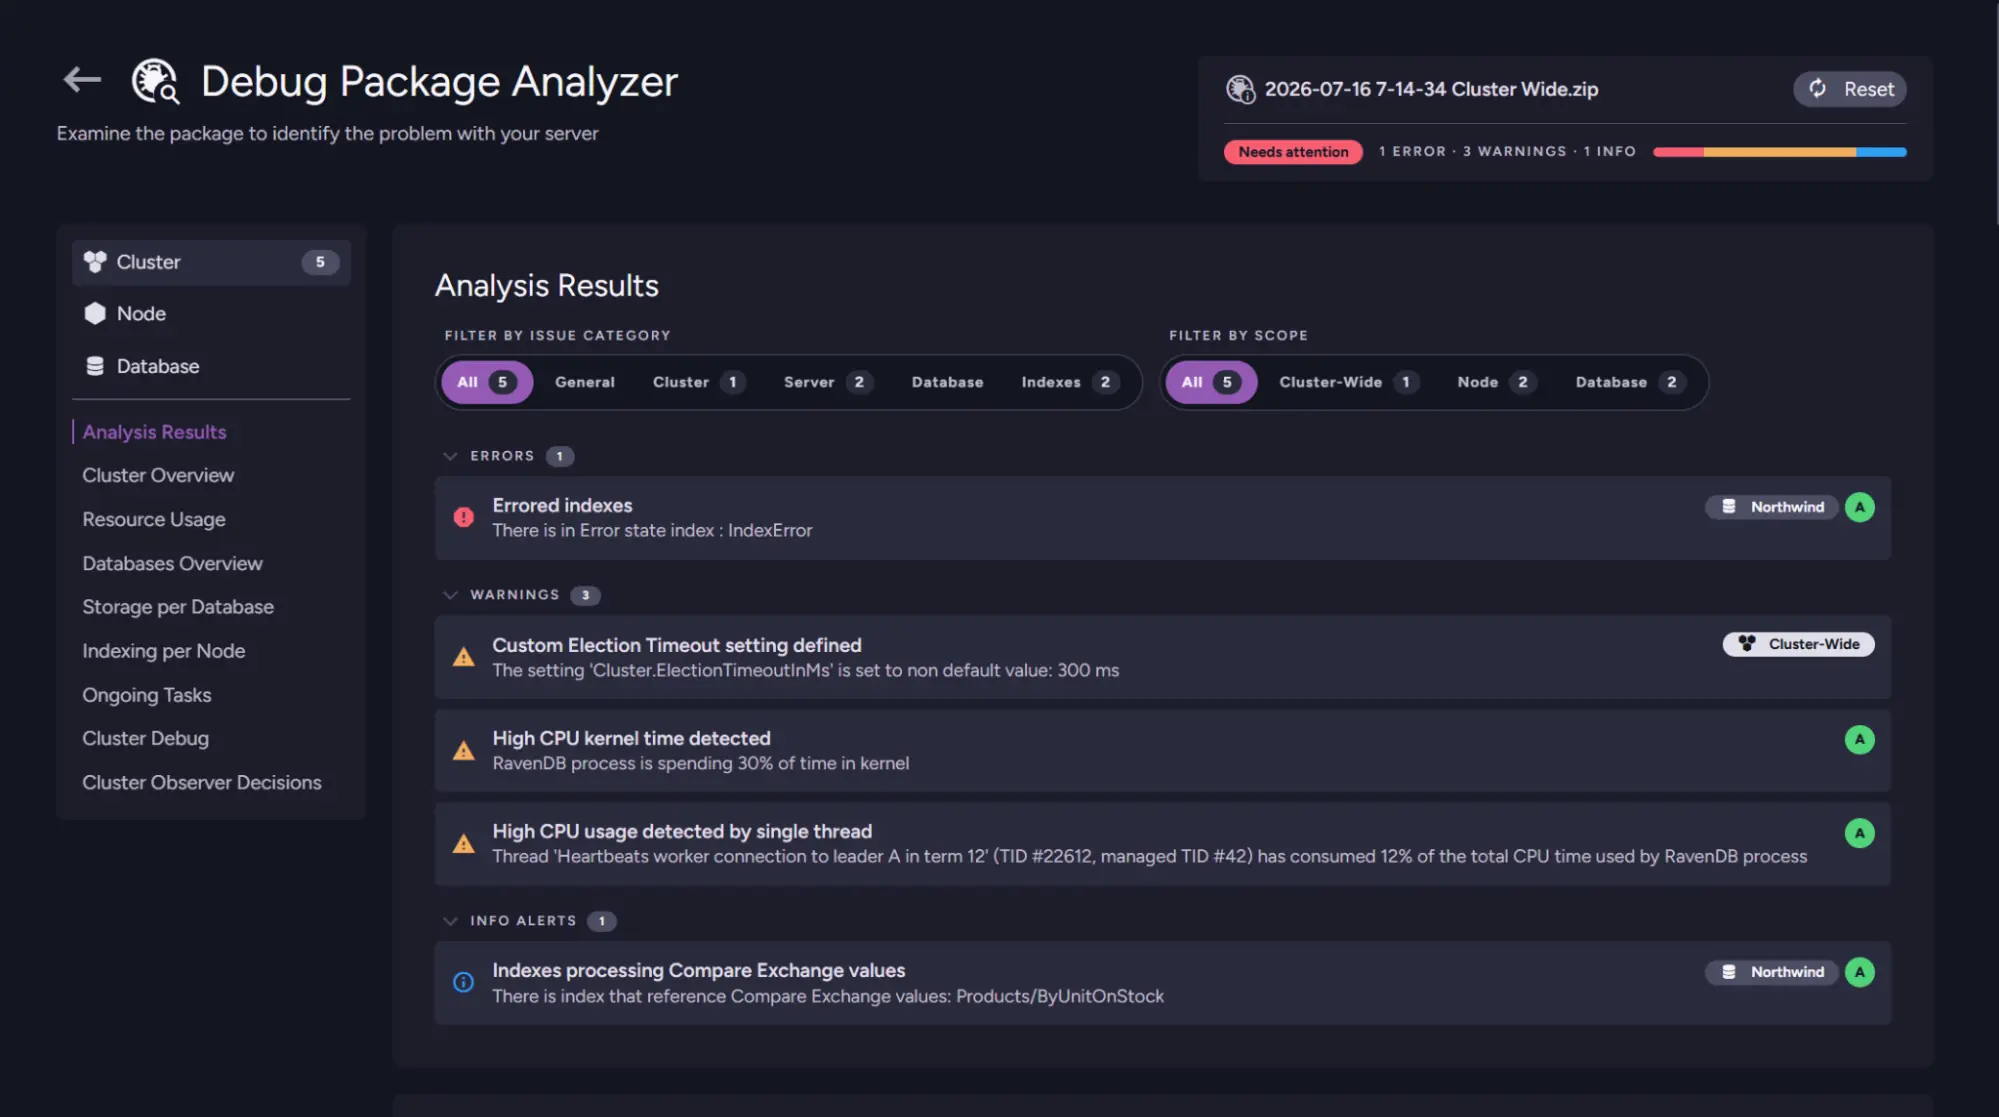
Once the analysis finishes, you get three things:
- A package summary with the file name, creation date, and overall verdict, such as Needs attention, plus the number of errors and warnings.
- A Cluster / Node / Database switcher, with issue counts for each scope.
- An Analysis Results list, which you can filter by category and scope.
That is your map. The cases below show you where to look and how to read what you find.
Reading the analysis as a whole
Analysis Results
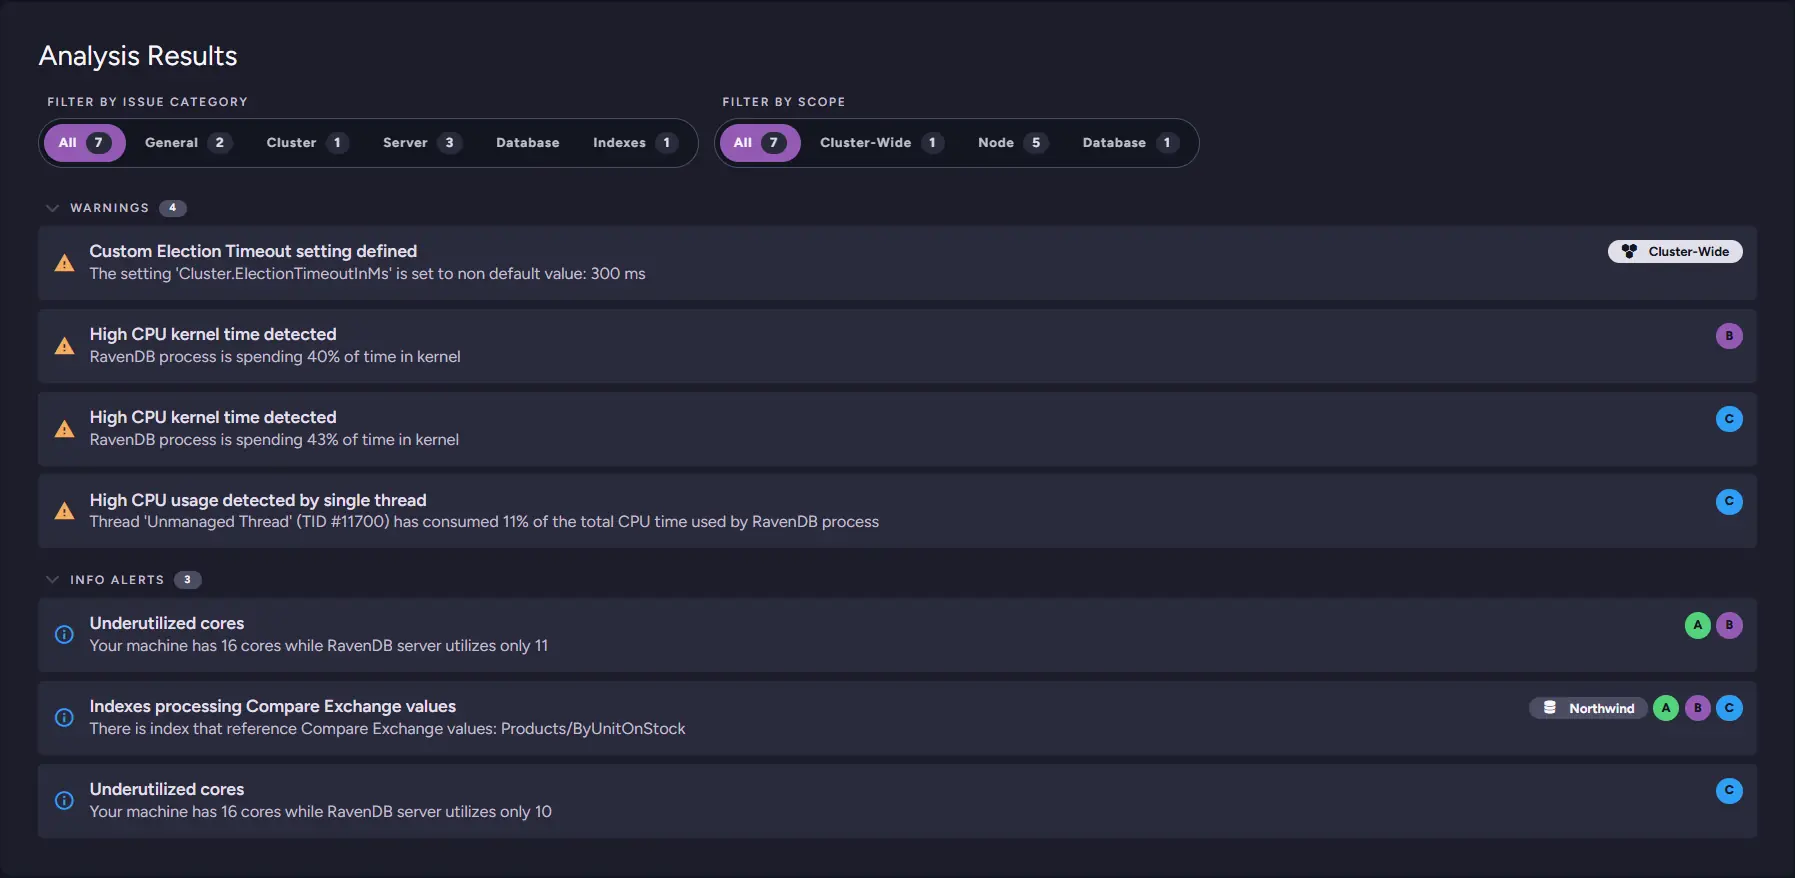
Analysis Results is the analyzer's own read of the package. Open it first, because it tells you what the analyzer already noticed so you do not have to rediscover it by hand. Issues are grouped by severity, into Errors, Warnings, and Info Alerts, and each carries a short description and a recommended action where one applies. Two filters sit above them and work independently:
- Filter by issue category: what kind of finding it is (General, Cluster, Server, Database, Indexes).
- Filter by scope: where it applies (Cluster-Wide, Node, Database).
The two are orthogonal, so a Server-category issue can be Node-scoped, and the count badges update as you filter.
Read the scope badge on each issue
Every issue is tagged with where it came from, and the badge is worth reading before the text.
- A Cluster-Wide pill means the finding is true of the cluster as a whole, like a custom
Cluster.ElectionTimeoutInMsvalue. - A node avatar, or several, means the finding belongs to those specific nodes.
- A database pill with node avatars means it is scoped to one database on those nodes, like an index that references compare-exchange values.
The scope tells you how far to chase a problem before you have even read the description.
Issues are deduplicated, but only when identical
Per-node analysis reports the same cluster-wide finding once for every node. The analyzer collapses issues with identical content into a single item carrying every contributing node tag, so an index using Corax appears once with all three node tags rather than three times. The catch is that the content has to match exactly:
- Two nodes reporting high CPU kernel time at 40 percent and 43 percent stay as two entries, because the numbers differ.
- Two nodes both reporting 16 cores with only 11 used merge into one item; a third node using only 10 stays separate.
So a finding that appears more than once is usually the same class of problem measured slightly differently on each node, not a failure of the grouping.
Each context has its own results
Analysis Results appears in the Cluster, Node, and Database contexts, scoped to what you are looking at, and the context switcher shows a count badge for each. A finding that matters for one database shows under that database; a node-specific finding shows under that node. Use Analysis Results as your starting point, then confirm anything it flags against the panel that holds the underlying data. Before you trust a short or empty result, check the Analysis Errors banner.
The Analysis Errors banner
One habit before the first case: check the analysis errors banner. The analyzer processes the package in many small components, each responsible for a different section. If one cannot parse its data, the analyzer shows it in the banner with an expandable stack trace.
Do not ignore those failures. A short issue list alongside three failed components does not mean the cluster is healthy. It means the analysis is incomplete, and treating it as complete can lead you to give the customer the wrong answer with confidence.
Read this banner before you conclude that nothing is wrong.
- If it is empty, the analysis ran end to end and a clean result carries weight.
- If it lists errors, note which node and which component failed, and treat that part of the picture as unknown rather than fine.
Cluster context
Cluster Overview
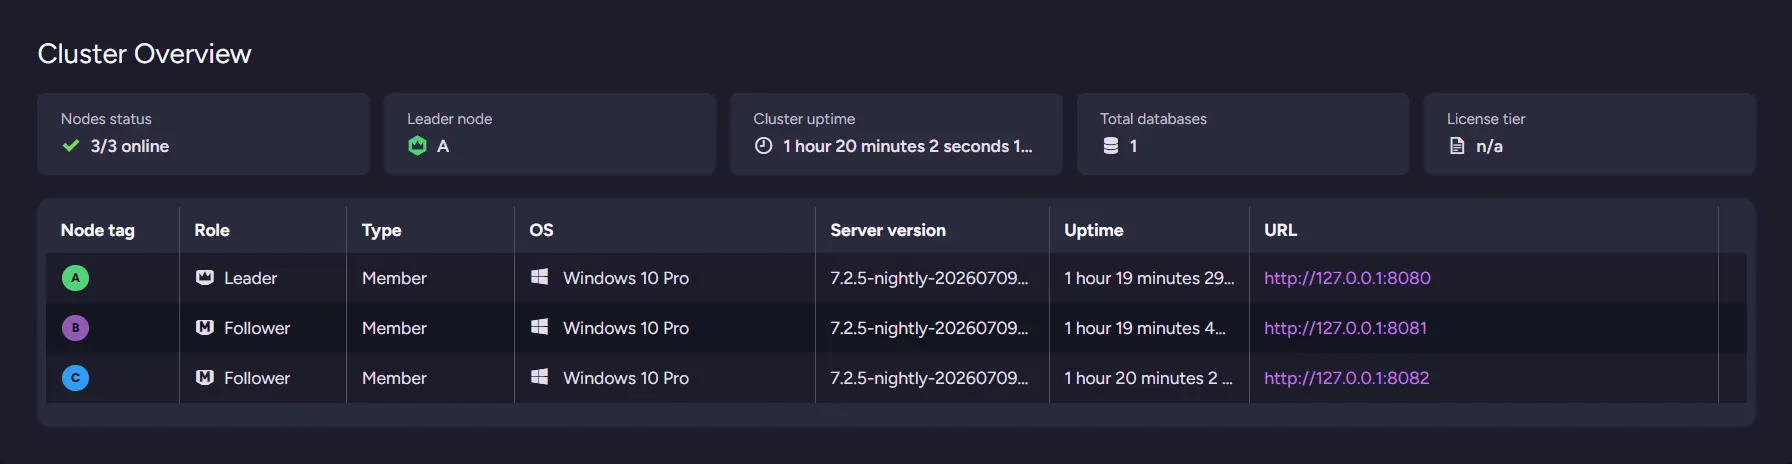
Cluster Overview is where you orient yourself. Five tiles summarize the cluster:
- Nodes status
- Leader node
- Cluster uptime
- Total databases
- License tier
A per-node table sits below them, with each node's role, type, OS, server version, uptime, and URL.
Start with nodes status
The nodes status tile reads something like 3/3 online. The package has no explicit online flag, so this is derived: the total is the number of nodes in the summary, and the online count is the number that actually have captured information. A node counted in the total but missing its captured info was unreachable when the package was taken. When any node is offline the tile switches from success to a warning color.
This one number shapes how you read everything else. If a node was unreachable at capture, its data is absent from every other panel, and its tasks may have moved elsewhere. Knowing that up front saves you from reading missing data as empty data.
Scan the node table for the values that should match
Most columns should be identical across a healthy cluster, so the value that differs is the interesting one.
- Server version: a node on a different build is a mixed-version cluster, usually a rolling upgrade that stalled, and it explains a surprising amount of odd behavior.
- Uptime: a node with far less uptime than its peers restarted recently, so ask why. A lone recent restart often sits right before the problem in the ticket.
- Type: Members vote in elections and count toward consensus; Watchers do not. A node in the wrong type is worth flagging.
- Role: which node was leader, which you will want when you read Cluster Debug and Cluster Observer Decisions.
License tier is not just trivia
The license tier tile matters because some behavior depends on it. Whether tasks fail over when a node goes down, for example, depends on the Highly Available Tasks feature. It can read n/a on development or nightly builds. Keep the tier in mind when you reach the Ongoing Tasks and Cluster Observer Decisions panels. Use Cluster Overview to set the scene, then move to the panel that matches the symptom in the ticket.
Resource Usage
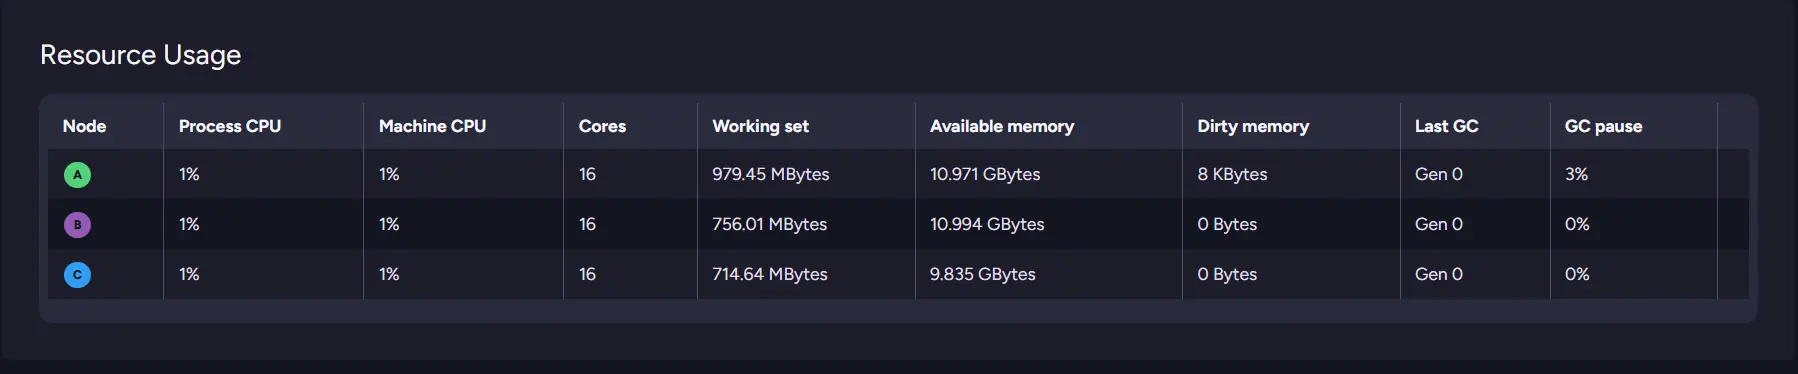
Resource Usage puts every node's CPU, memory, and garbage collection activity in one table. The important part is not any single number. It is how the nodes compare.
Look for the node that stands out
If all three nodes show similar CPU and memory usage, the load was probably spread evenly. If one node has high CPU while the others are mostly idle, you have a clear place to investigate.
A node that looks quiet here may still have spiked shortly before or after the capture. A quiet table is useful evidence, but not proof that nothing happened.
Keep in mind that the debug package is only a snapshot. These values show what was happening when the package was captured, not what happened over time.
Compare RavenDB with the whole machine
CPU is shown from two angles:
- RavenDB process usage
- Total machine usage
When the machine's CPU is high, but RavenDB's is low, something else on the server was using those resources. RavenDB may be suffering from the pressure rather than causing it. The GC column shows garbage collection activity. Heavy GC can explain pauses and latency that will not appear in query metrics. Memory completes the picture and helps identify which node was under the most pressure.
Use it for triage
When a ticket says only that "the cluster is slow," Resource Usage helps narrow the problem down to a specific node. Once one node stands out, switch to that node in the Node context and open Performance Metrics for more detail about its CPU, memory, and GC activity. Think of Resource Usage as the panel that tells you which node deserves a closer look.
Databases Overview
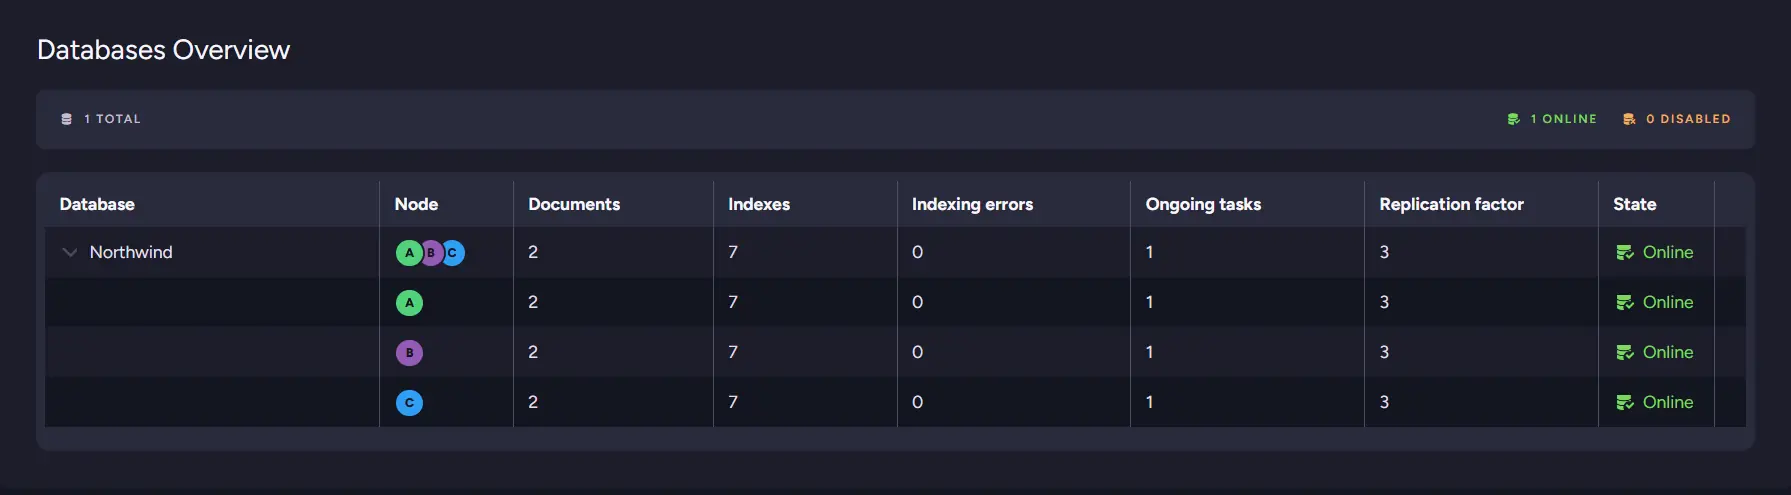
Databases Overview aggregates each database across the nodes that hold it, so you can see the shape of a database group at a glance. A header strip counts the databases as total, online, and disabled. Each database is one row, with the nodes shown as a stack of avatars and columns for:
- Documents
- Indexes
- Indexing errors
- Ongoing tasks
- Replication factor
- State
Click a row to expand it into the per-node breakdown.
Read across, then down
On a healthy group the collapsed row shows one clean set of numbers because every node agrees. Expand it and look for the node that does not:
- A lower document count means that node has not caught up.
- A non-zero figure under Indexing errors on one node isolates the problem to that node.
- A State that differs from its peers is the clearest signal of all.
The collapsed row summarizes State across nodes, so a group where one member disagrees is easy to catch without expanding.
Check replication factor against the node count
Replication factor is how many copies the database is meant to keep. Compare it with the number of nodes actually holding the database in the avatar stack. A replication factor higher than the number of nodes present means the database is under-replicated, which points either at a node that is down or at a distribution that is never completed.
Use this panel to decide which database to investigate, then switch to the Database context and select chosen database.
Storage per Database
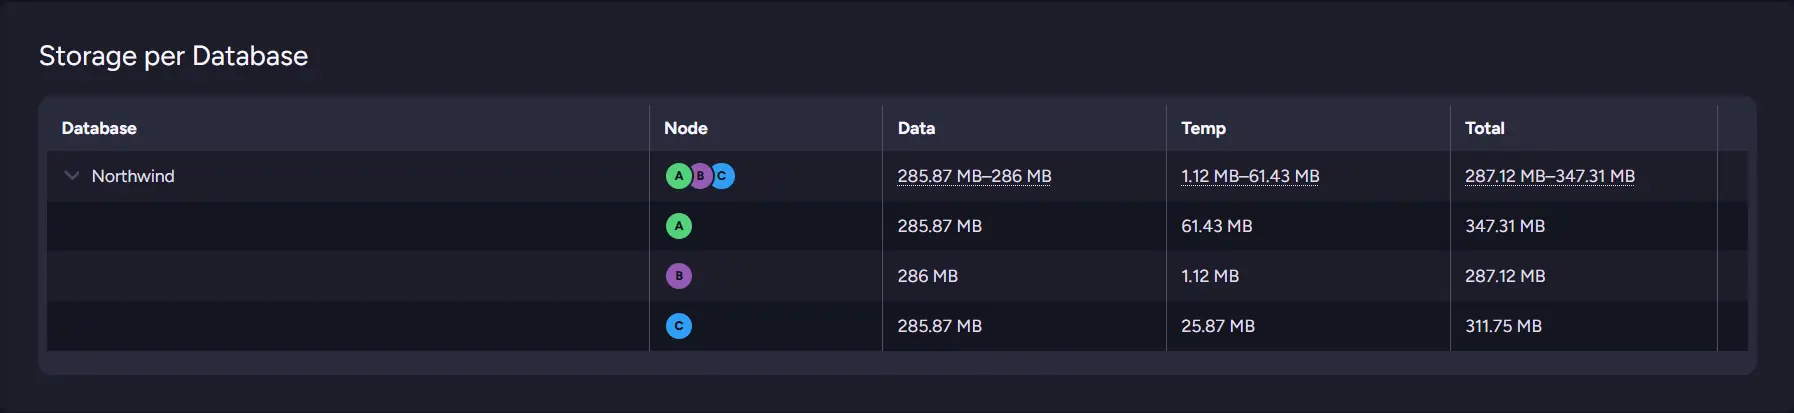
Storage per Database shows disk usage by both database and node. For each combination, it lists:
- Data
- Temp
- Total
What the numbers mean
Data is the size of the database's persisted data files. Temp is RavenDB's temporary storage. This includes scratch files used to hold different data versions for concurrent transactions and compression buffers used before a transaction is written to the journal. Indexes also maintain their own temporary files.
Temp is shown separately because a large temporary footprint means something different from ordinary database growth. It often points to large or long-running write transactions, heavy indexing, or other work keeping scratch space in use.
Compare the nodes
The same database should usually have a similar size on every node that holds it. A clear difference is worth investigating:
- One node with much less data may not have finished replication or caught up with the others.
- One node with much more data may have missed a compaction that ran elsewhere.
Read across each database row and look for the node that does not match its peers.
Use it for disk problems
When a disk is growing unexpectedly or a volume is filling up, start here. This panel answers two questions at once:
- Which database is using the space?
- Which node is holding it?
Once you have narrowed the problem down to one database, switch to the Database context and open Storage Overview. It shows the same data, temp, and total split for that database, broken down by node, so you can confirm and document the finding.
Indexing per Node

Indexing per Node shows indexing throughput for each node, in three columns:
- Indexed/s: documents fed into indexes per second.
- Mapped/s: map outputs produced.
- Reduced/s: reduce outputs.
A map-only index moves the first two; a map-reduce index moves all three.
Zeros may not be the red flags
These are per-second rates at the moment of capture, not averages over time. An all-zero table does not mean indexing never runs, only that nothing was being indexed when the package was captured, which is the common case on a caught-up cluster.
It’s per node
The summary exposes only a per-node aggregate indexing speed. There is no per-database breakdown in it, so this panel cannot tell you which database's indexes were doing the work. The per-database breakdown is available in Databases context, described later in this guide.
Compare the nodes
Read the rates across nodes. If one node indexes far slower than the others, or is doing far more mapping and reducing, that node is carrying more indexing load or struggling to keep up. Pair a busy node here with its Resource Usage row: heavy indexing that coincides with high CPU or heavy GC on the same node is a coherent story.
To attribute indexing work to a specific database, switch to the Database context and look at that database's Index Stats and, where the database exists on this server, its Indexing Performance. That is a limit of what the summary stores, not missing data in the panel. The per-database view is in the Database context, under Index Stats and Indexing Performance.
Ongoing Tasks

Ongoing Tasks lists the cluster's tasks by type and shows which nodes run them.
Why tasks are grouped by type
In the package summary, task entries are recorded per node, but their database field is left empty. Because of that, the analyzer can group them only by task type, not by database. At the cluster level, you can see that external replication or periodic backup tasks exist and which nodes run them. You cannot see which database each individual task belongs to. That is a limitation of the information stored in the summary, not missing data in the panel.
For the per-database breakdown, which task belongs to which database, its name, responsible node, and state, switch to the Database context and open Ongoing Tasks.
Compare the panel with the expected setup
Use this panel to check whether the cluster matches what the customer says is configured. For example:
- If backups should run every night, there should be a periodic backup task.
- If data should replicate to another cluster, there should be an external replication task.
- The tasks should appear on the nodes you expect.
Be careful with the responsible node
Each task has one responsible node, but that responsibility can move. When a node goes down, RavenDB normally assigns its tasks to another node until it returns. A task is therefore not necessarily stopped just because its original node was unavailable. There are two important exceptions:
- A task pinned to a mentor node waits for that node to return.
- Without the Highly Available Tasks license feature, the task resumes only when its responsible node comes back.
Cross-check missing nodes
If the package shows only two of three nodes online, do not assume that every task assigned to the missing node stopped. Instead, check whether RavenDB should have moved it:
- Look in Cluster Observer Decisions for a reassignment.
- Check whether the task was pinned to a mentor node.
- Check whether the license includes Highly Available Tasks.
For the full per-database task list, switch to the Database context and open Ongoing Tasks. There, each task is listed separately with its responsible node.
Cluster Debug
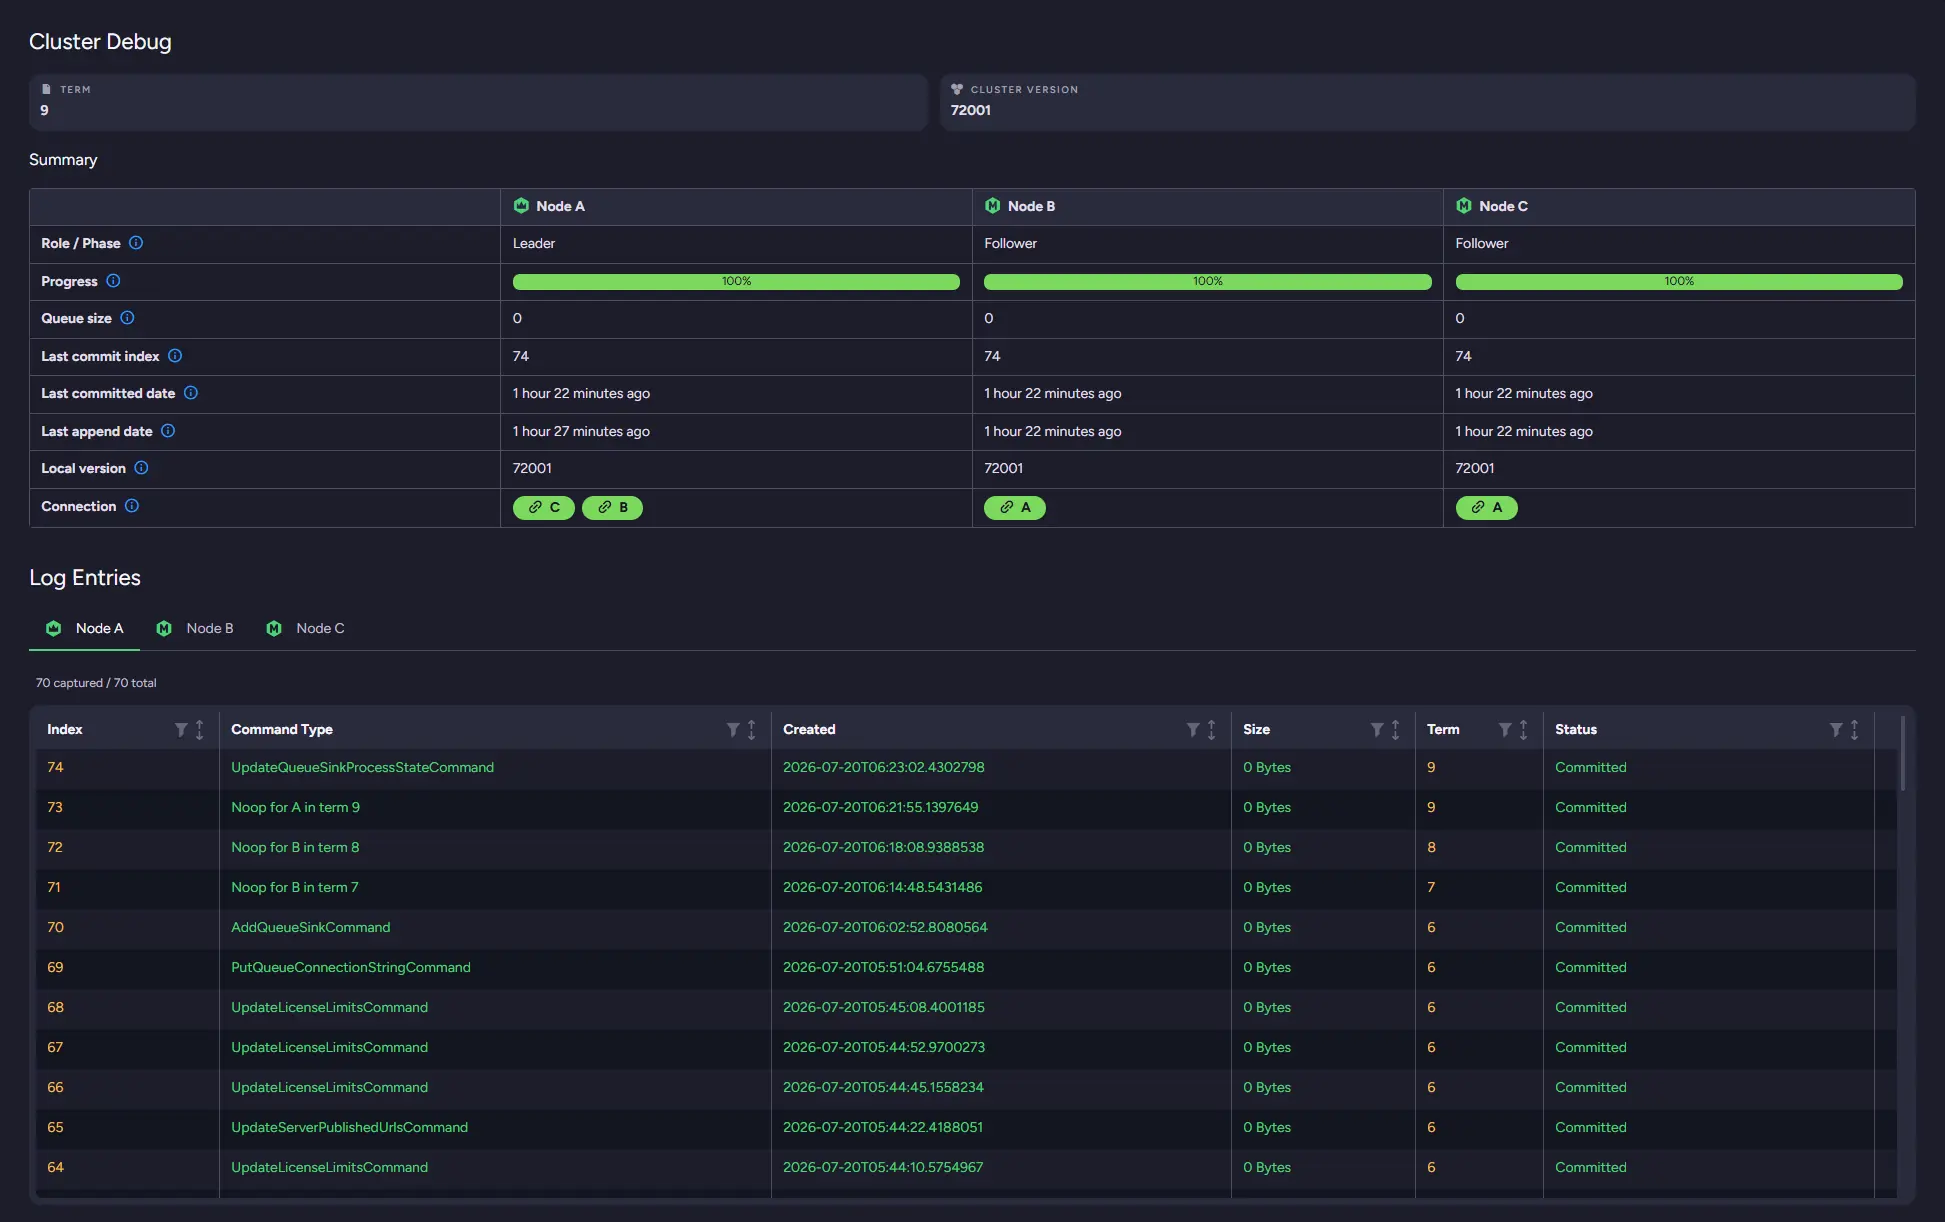
Cluster Debug recreates the live Cluster Debug view from each node's cluster log, rendered read-only from the package. Two tiles head it, Term and Cluster Version. Below them a Summary table puts the nodes side by side, and below that the raft Log Entries, with a tab per node.
Read the Summary table across the nodes
The summary has one column per node and a row per property, so you compare left to right.
- Role / Phase: leader or follower.
- Progress and Queue size: 100 percent with a queue of zero is caught up; a growing queue is a node falling behind.
- Last commit index: every node should be on the same index, so a lower number means that node has not caught up.
- Last committed date and Last append date: the timing behind the commit index.
- Connection: the nodes each node currently links to. On a healthy three-node cluster every node connects to the other two, so a missing entry is a network partition between those two machines.
Reading the "no recent commits" warning correctly
The live view warns when a node has not committed for over two minutes, measured against the current clock. That would be meaningless for a package captured hours ago, because every node would look stalled. The analyzer instead measures against the most recent commit time seen across the snapshot's nodes. So the warning does not fire for the whole package just because it is old, but a node that has fallen behind the others still flags. When you see it, one node was lagging the rest at capture, which is the signal you actually want.
Let the log entries tell the recent history
The Log Entries table lists raft commands with their index, command type, timestamp, size, term, and status, and a header like "70 captured / 70 total" tells you whether the whole log was captured or truncated. The term column and the Noop entries are the ones to read for stability. Raft appends a "Noop for X in term N" entry whenever a new leader takes over a term, so a run of Noops across consecutive terms, 7 then 8 then 9, is the fingerprint of repeated elections before the cluster settled. A stable term with no recent Noops means the cluster has not changed leaders lately.
Use it for consensus problems
When the symptom is a leadership change, a node that will not join, or writes that stall cluster-wide, this is the panel. A node stuck on an old commit index or term, a non-empty queue, or a missing connection points at a consensus or network problem rather than a data or query one.
This panel is a cross-check. Node status tells you a node was in trouble; Cluster Observer Decisions tells you how the cluster reacted; Cluster Debug shows the consensus state underneath both.
Cluster Observer Decisions

The Cluster Observer runs on the cluster leader. It watches the health of the cluster and each database group, then reacts when something goes wrong. It can:
- Promote or demote nodes within a database group.
- Move a database instance to rehab when it falls behind or stops responding.
- Add a replacement node when Dynamic Database Distribution is enabled and the replication factor needs to be maintained.
Even something as ordinary as a full disk can cause a database instance to be moved to rehab. The Cluster Observer Decisions panel records these actions. It is the closest thing in the package to the cluster explaining what it noticed and what it did about it.
Read the log correctly
The observer log can be long, so the panel shows only its most recent entries. The label tells you exactly what you are seeing is the latest N shown, newest first. Pay attention to the word latest.
An earlier version of the panel labeled the same entries as first, which suggested that they came from the beginning of the log. In reality, the panel displays the end of the log in reverse order. You are seeing the cluster's most recent decisions, not the point where the problem began. That makes the panel useful for understanding the current state. For a slow-building problem, however, the important decision may sit earlier in the full log, outside the visible window. The timestamps come from the cluster itself, so they remain consistent within the snapshot even when they do not match your local clock.
Look for patterns
A single entry shows one action. A sequence of entries tells you what was happening. For example:
- A node promoted and demoted repeatedly may be unstable or flapping.
- A node moved to rehab and never restored may have failed to catch up.
- A task reassigned after a node went offline shows that failover took place.
This panel is most useful as a cross-check. Node status and Cluster Debug tell you that a node was in trouble. Cluster Observer Decisions tells you how the cluster responded.
Node context
The Node context focuses on a single node. You usually arrive here from Resource Usage, once one node has stood out. A node selector at the top switches between the nodes the package captured.
Alongside the two node-specific panels below, this context also carries Storage per Database, Indexing per Node, and Ongoing Tasks, filtered to the selected node, so each shows a single row or that one node's tasks rather than the whole cluster. The cross-node comparison those panels give at the cluster level is replaced here by switching the node selector.
Node Overview

Node Overview is the single-node counterpart to the Cluster Overview node table: a row of tiles for the selected node.
- Node status
- State: the raft role, Leader or Follower.
- Type: Member (votes in elections) or Watcher (does not).
- OS
- Server version
- Uptime
- URL
Read it the same way you read the Cluster Overview table, just for one node. The values worth a second look are the ones that should match the rest of the cluster: a server version that differs from the other nodes is a mixed-version cluster, and an uptime much shorter than its peers means this node restarted recently. Confirm you are on the node you meant to be on, then move to Performance Metrics.
Performance Metrics
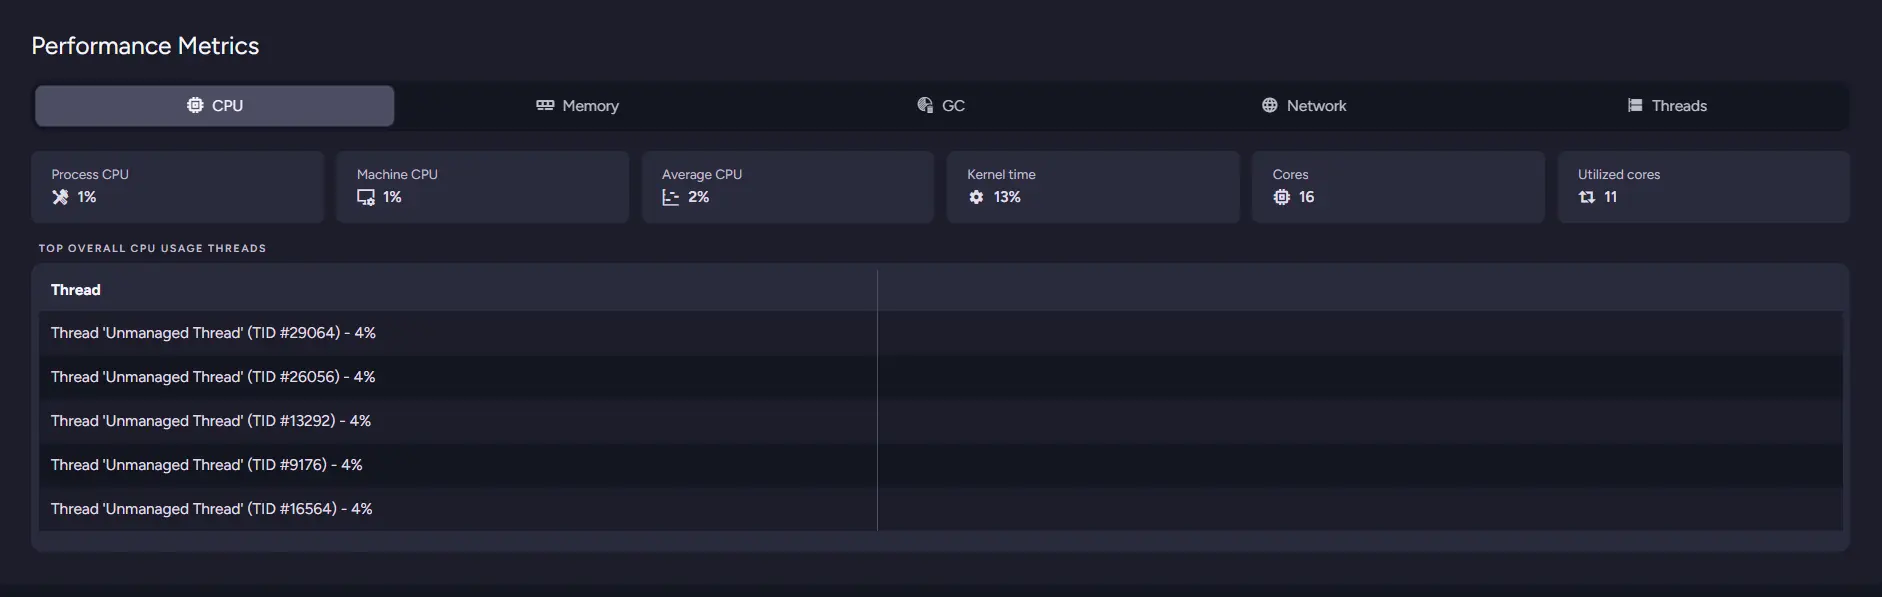
Performance Metrics is the detailed view of the one thing Resource Usage only summarized. It breaks the selected node's activity into five tabs: CPU, Memory, GC, Network, and Threads. Each leads with a row of stat tiles and, where it helps, a supporting table.
CPU
The CPU tab shows six tiles:
- Process CPU and Machine CPU, as on Resource Usage.
- Average CPU.
- Kernel time.
- Cores and Utilized cores.
Kernel time is the one to watch: it is the share of CPU spent in kernel mode rather than in RavenDB's own work, so a high figure points at heavy system calls, I/O, or context switching rather than useful load. This is exactly what Analysis Results means when it flags high CPU kernel time. Utilized cores set against Cores tells you how much of the machine RavenDB is actually using, and a gap between them is what drives the underutilized-cores alert. Below the tiles, a Top overall CPU usage threads table ranks the heaviest threads by share, a quick way to see whether one thread dominates before you open the Threads tab.
Memory and GC
The Memory and GC tabs carry the per-node detail behind the memory and GC columns on Resource Usage. Memory expands on working set, available, and dirty memory; GC expands on the collection generations and pause time. The GC tab is often the most revealing of the whole panel: heavy garbage collection explains pauses and tail latency that never show up in query timings. If Resource Usage pointed you here because one node looked busy, these two tabs are where you find out whether it was real work, memory pressure, or GC.
Network
The Network tab is fetched on demand. It shows a tile for the count of active TCP connections and a table broken down by TCP state, with the count per state and the top remote endpoints for each. It also holds the node-to-node latency check: a per-node ping table with, for each target, whether the setup connection is alive, the TCP ping time, and a status. The thresholds mirror RavenDB's own: a ping over two seconds is a warning, over five seconds is an error. Slow or failing pings between specific nodes point at a network problem between those machines rather than at RavenDB itself, and often explain replication lag or consensus trouble you saw elsewhere.
Threads
The Threads tab focuses on the node's runaway threads: the threads consuming significant CPU. Where the CPU tab's top-threads list is just a ranking, this tab is the place to act on it. At the top, "Open in Stack Traces viewer" opens the package's captured stacks for this node in the existing Stack Traces tree viewer, loaded automatically with no manual download or import. Pair a runaway thread with its stack to see the code path that was hot. A thread burning CPU is a symptom; its stack is the explanation.
Database context
The Database context narrows everything to one database. You reach it from Databases Overview or Storage per Database, once a specific database is the suspect. A searchable selector picks the database, and a node selector scoped to the nodes that hold it lets you compare across them.
The panels split into two groups:
- Global (Database Overview, Storage Overview): the database across all the nodes that hold it at once.
- Node-scoped (Statistics through Settings): one node at a time, chosen with the node selector.
Database Overview (global)
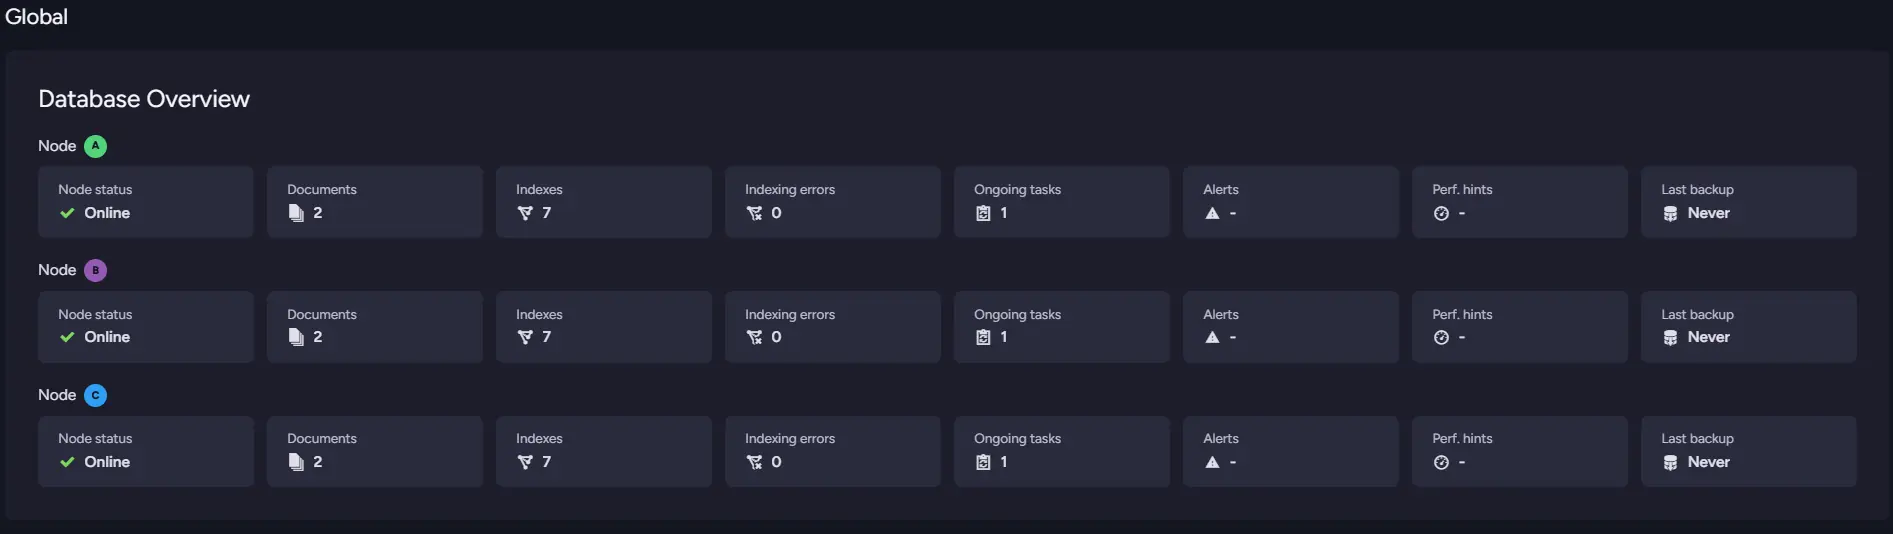
Database Overview is the per-node summary for the selected database, one block of tiles per node stacked down the panel:
- Node status
- Documents
- Indexes
- Indexing errors
- Ongoing tasks
- Alerts
- Perf. hints
- Last backup
Because the nodes are stacked, reading down a single column compares that measure across the whole group, and the node that disagrees is easy to spot. A lower document count means that node has not caught up; a non-zero Indexing errors on one node isolates the problem there; a node status or alert count that differs from its peers is worth chasing. Last backup is the one people forget to read: a value of Never, or a date far older than the others, is a finding in itself. This panel tells you whether a problem is database-wide or isolated to one node.
Storage Overview (global)
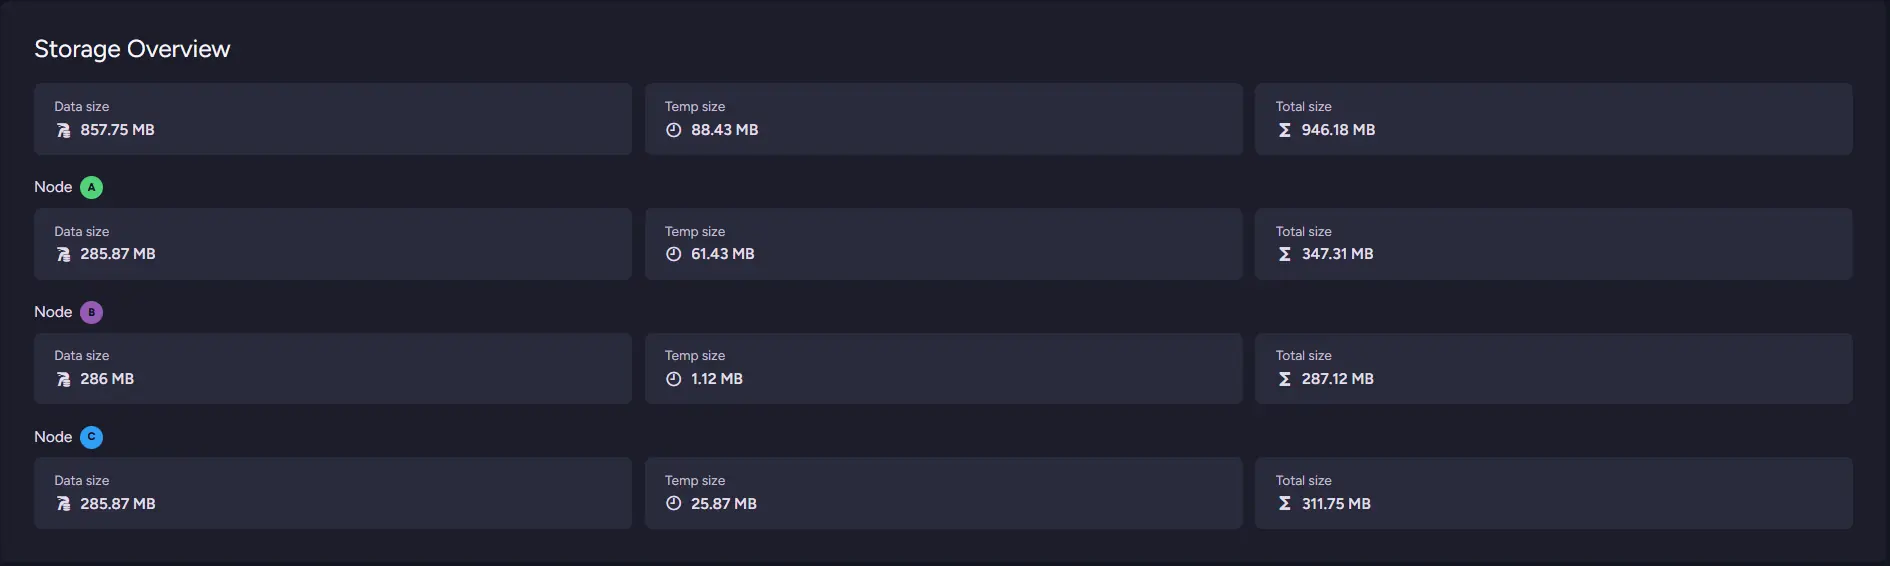
Storage Overview is the per-database drill-down from Storage per Database. A row of aggregate tiles at the top gives Data size, Temp size, and Total size summed across every node that holds the database, and a per-node block below repeats the split for each node. Read the aggregate first, then the breakdown. The aggregate total is the real disk cost across the cluster, so a 286 MB database replicated on three nodes shows as roughly 860 MB of data; that is expected, not a leak. The per-node blocks are where the outlier shows: it is common to see Data almost identical on every node while Temp varies widely, for example one node holding 60 MB of temp against another's 1 MB. A large Temp figure on a single node means long-running transactions, heavy indexing, or other work holding scratch space at the moment of capture. You come here to confirm and document a storage finding that Storage per Database surfaced.
Statistics (node-scoped)

Statistics shows the selected database's core numbers on the selected node, as a grid of tiles:
- Documents, Indexes, Attachments, Revisions, Conflicts, Tombstones, Counters, Time series segments
- Size on disk, Temp buffers
- Database ID, Last indexing time, Architecture, Change vector
Most are routine counts, but a few are worth reading closely:
- Revisions can dwarf Documents when revisions retain heavily. A revision count in the thousands for a handful of documents is a common, easily missed explanation for disk usage.
- Conflicts, when non-zero, means replication produced conflicts that need resolving.
- Tombstones that pile up and never fall are often a replication symptom, since a tombstone cannot be purged until every node has acknowledged it. A large tombstone count alongside a lagging node is a coherent story.
- Architecture matters on large databases: a 32-bit process has tight memory-map limits that a 64-bit one does not.
Switch the node selector to compare. The Database ID should be identical on every node that holds the database; a different ID means it is not really the same database, usually a separate restore rather than replication. The Change vector shows each node's replication position, so comparing it across nodes tells you which node is behind.
Index Stats (node-scoped)
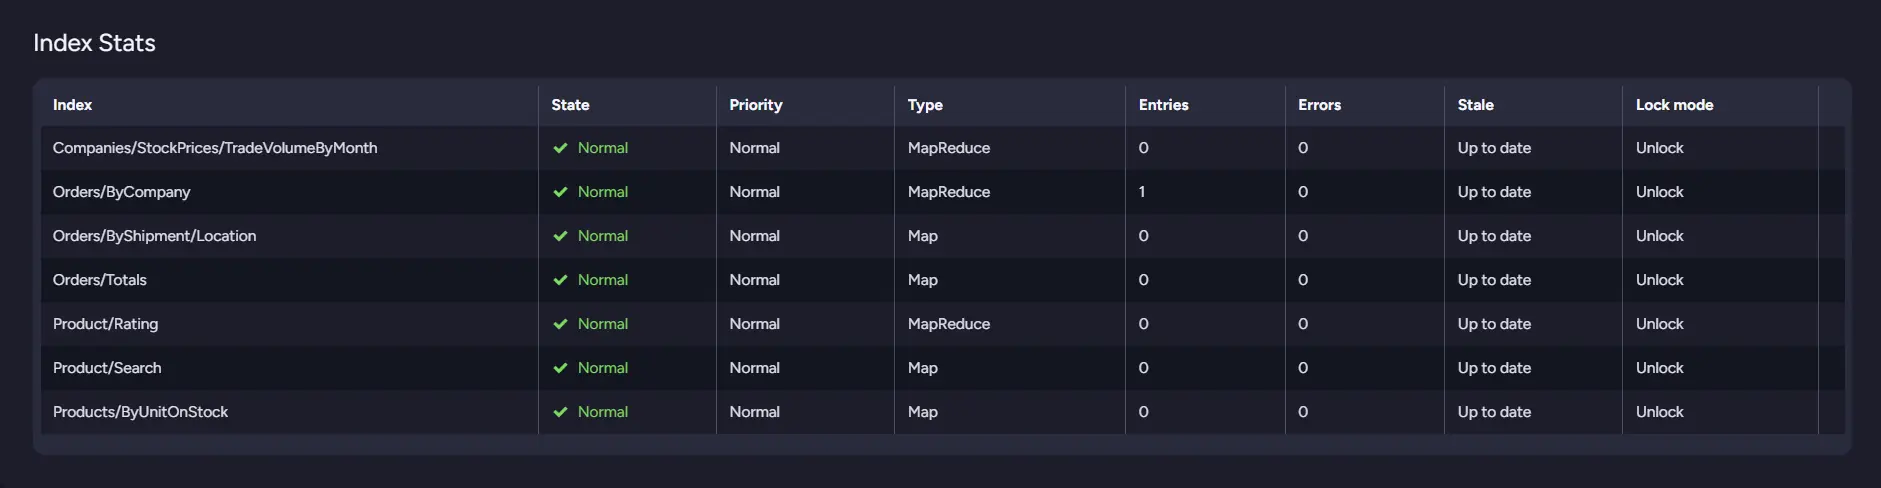
Index Stats is the per-node index table for the selected database, one row per index, with columns:
- State: Normal, Error, Disabled, or Idle.
- Priority
- Type: Map or MapReduce.
- Entries
- Errors
- Stale: Up to date or Stale.
- Lock mode
Three columns carry most of the signal:
- Stale tells you whether an index has caught up with the documents it covers. Stale on one node but up to date on another is the mismatch to chase.
- Errors is a per-index count; any non-zero value sends you to Index Errors for the detail.
- Lock mode surprises people: an index set to Locked or Locked (Ignore) will quietly reject definition changes, which explains a fix that "did not take."
It pairs naturally with Index Definitions, which shows what each index actually does.
Indexing Performance (node-scoped)

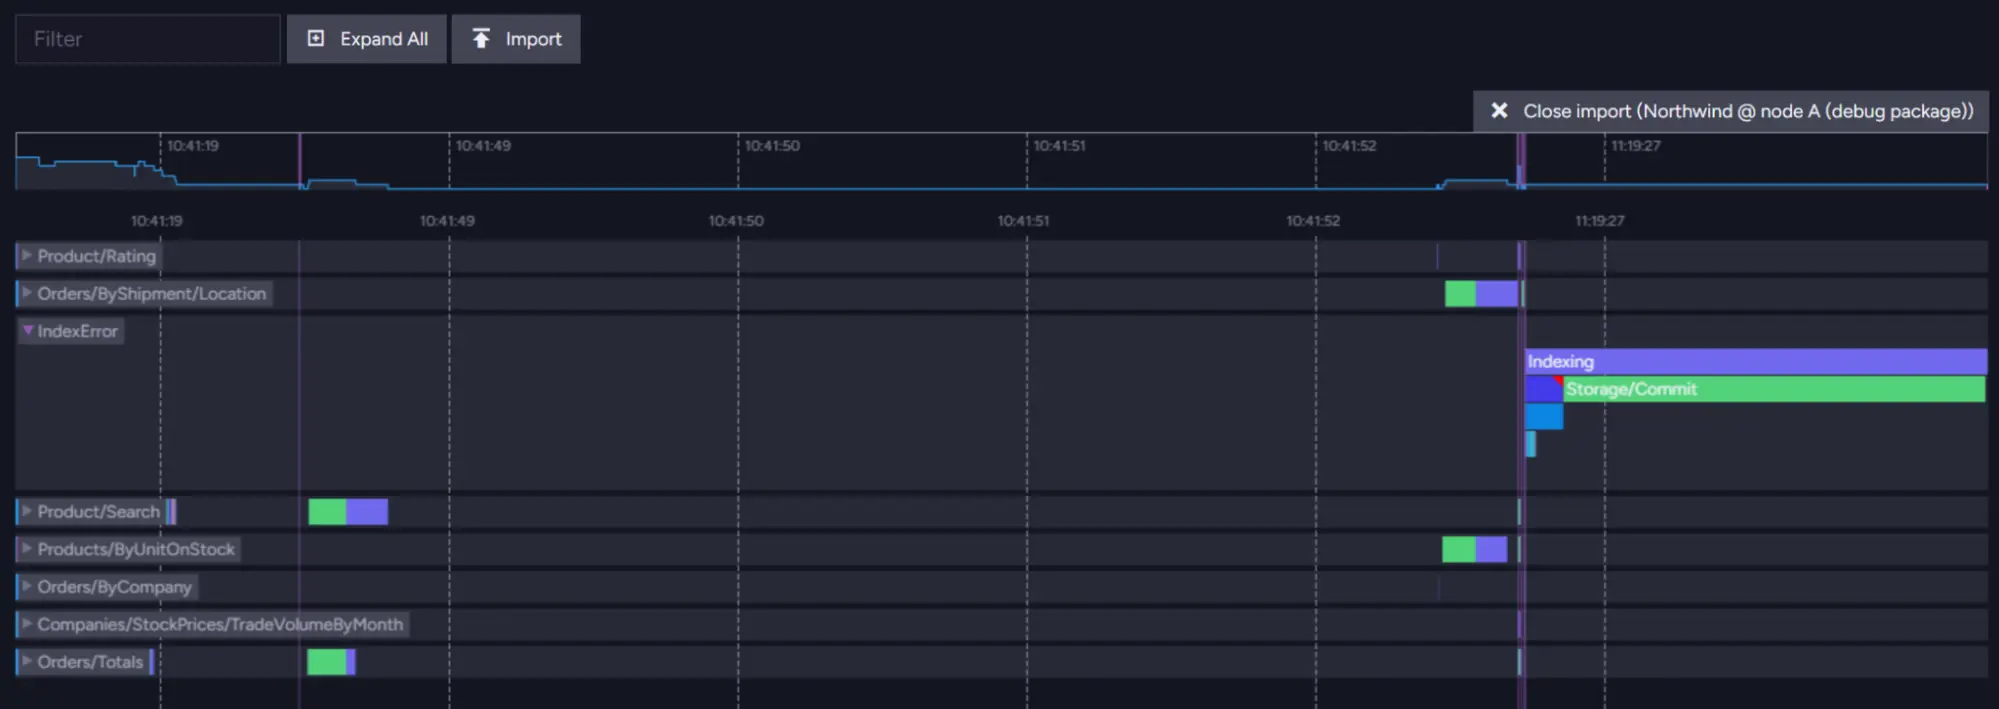
Indexing Performance is a launcher, not a table. It is a card with a single action that opens the package's indexing performance timeline in the interactive Indexing Performance viewer, with the per-node data imported automatically and no manual download. Because that viewer is database-scoped, the action works only when the selected database exists on the server you are using; when it does not, it is disabled with an explanation. Open it when you need the detailed indexing timeline for a database rather than the summary rates in Indexing per Node.
Index Definitions (node-scoped)
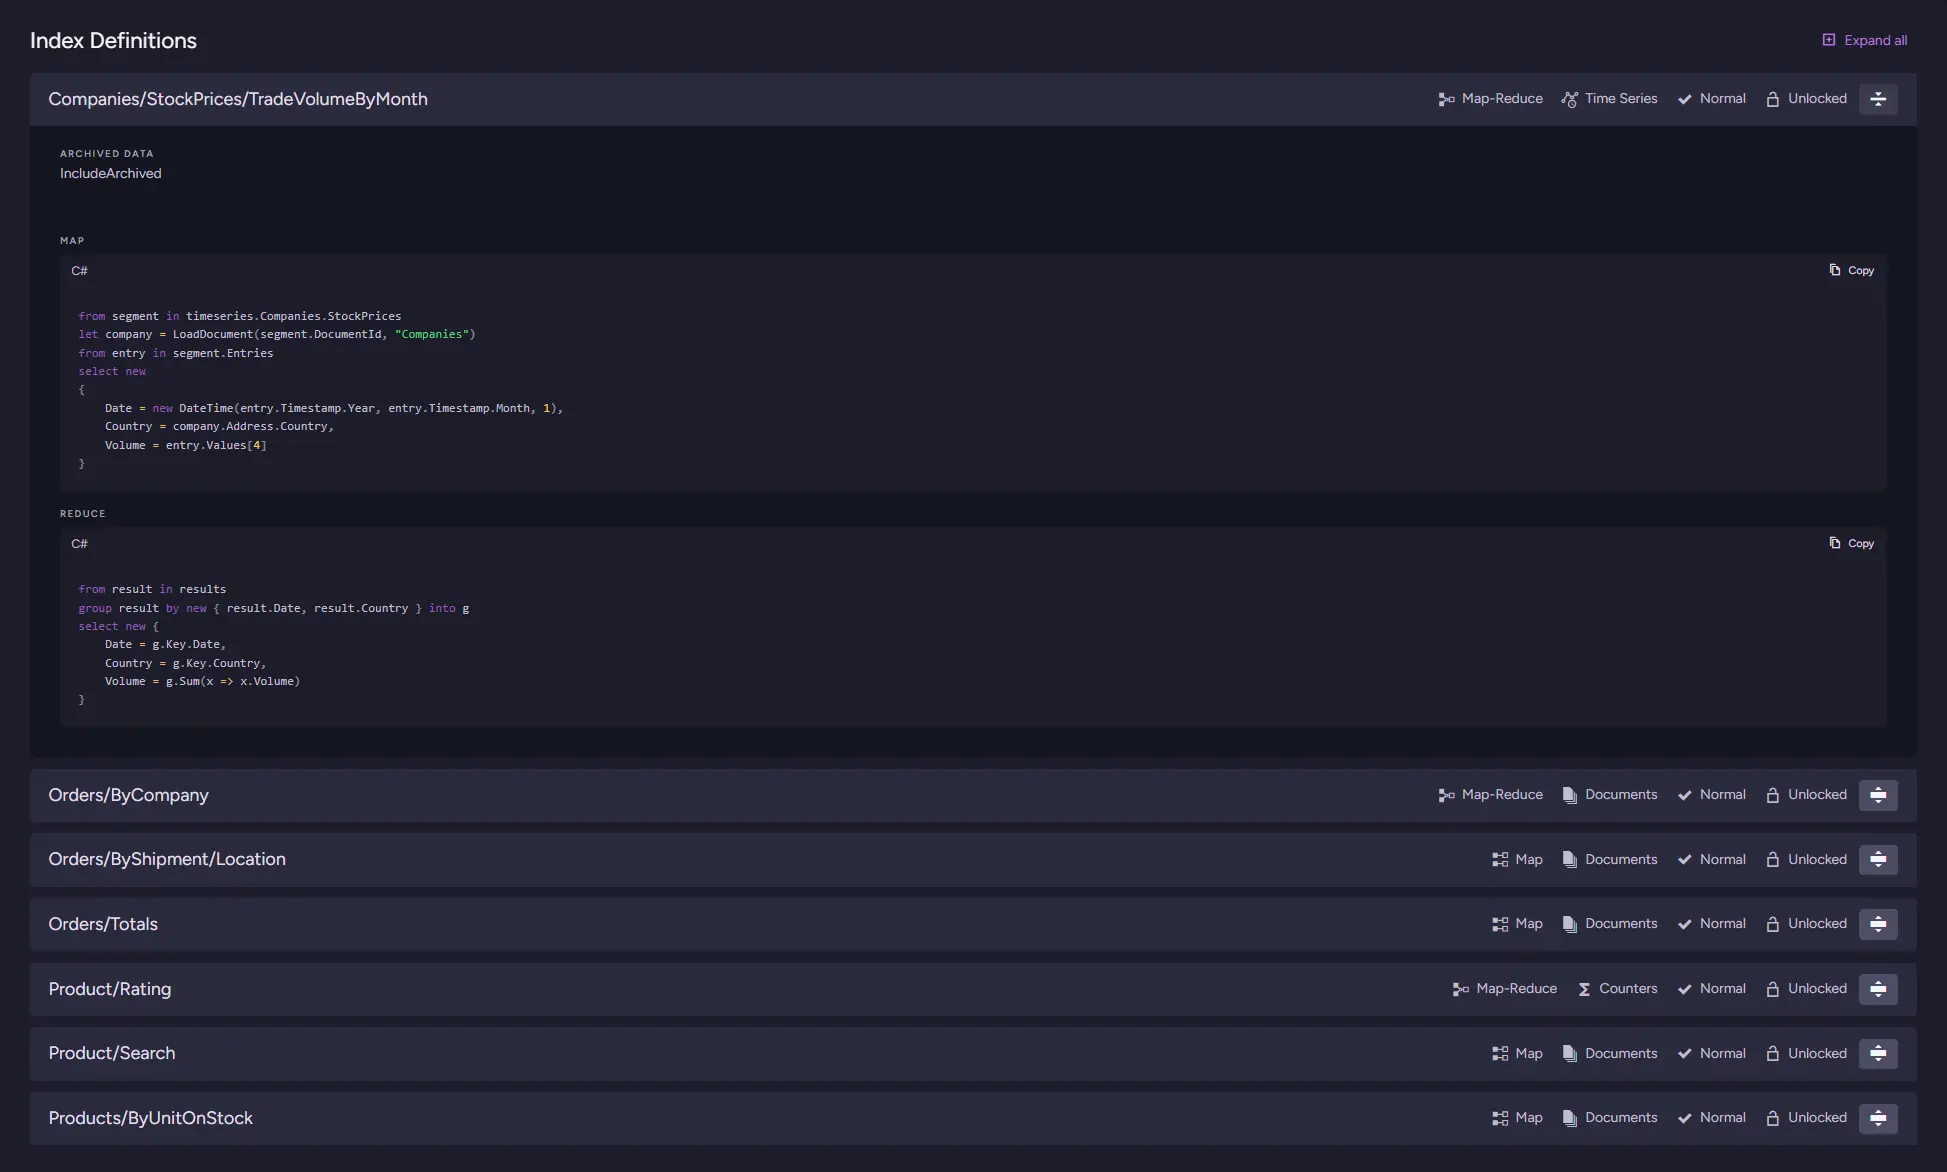
Index Definitions renders each index's full definition on the selected node, reusing the same panels as the live index list. Every index is a collapsed row by default, with an Expand all control at the top, because the map and reduce bodies get large. Each row carries badges before you even expand it:
- Type: Map or Map-Reduce.
- Source: Documents, Time Series, or Counters.
- State, such as Normal.
- Lock mode, such as Unlocked.
Expanding a row shows the map and, for a map-reduce index, the reduce function as C# with a Copy button, along with settings like archived-data handling and the index fields. A map-reduce index that outputs to a collection is marked accordingly, with detail chips for the reference pattern, references collection, reduce output index, deployment mode, compound fields, and additional assemblies. Use it to see exactly what an index does, and switch nodes to confirm the definition is identical across the nodes that hold it. A definition that differs between nodes explains behavior that differs between nodes.
Index Errors (node-scoped)

Index Errors reuses the live Index Errors view, showing the errors captured for the selected database's indexes on the selected node. Because this is a static snapshot, the edit-index and view-document links that would be live on a running server render as plain values rather than hyperlinks.
An empty panel says so plainly, that there are no index errors for this database on this node, and that is the healthy state. When Index Stats shows a non-zero Errors count, or Analysis Results flags a faulty index, this is where you read why: the error text usually names the document or the operation that failed, which is often enough to explain a stale or disabled index. Switch nodes to see whether an error is isolated to one node or present everywhere.
Ongoing Tasks (node-scoped)

Ongoing Tasks here is node-scoped, listing the tasks the selected node is responsible for this database, with a header that tallies how many are on that node and how many are active versus disabled. Unlike the cluster and node panels, which could only count tasks by type, each row is a distinct task:
- Task: the task type.
- Name
- Responsible node
- State: Active or Disabled.
This is the view that resolves the ambiguity the cluster panel left open. Where the cluster level could only tell you that a Queue Sink existed somewhere, here you see the actual task, its name, the node responsible for running it, and whether it is Active or Disabled. When you are chasing a backup that did not run or a replication that stalled, read the Responsible node together with the cluster's node status and Cluster Observer Decisions to tell whether the task was genuinely stopped or simply moved. Switch nodes to see the tasks each node is responsible for.
Settings (node-scoped)
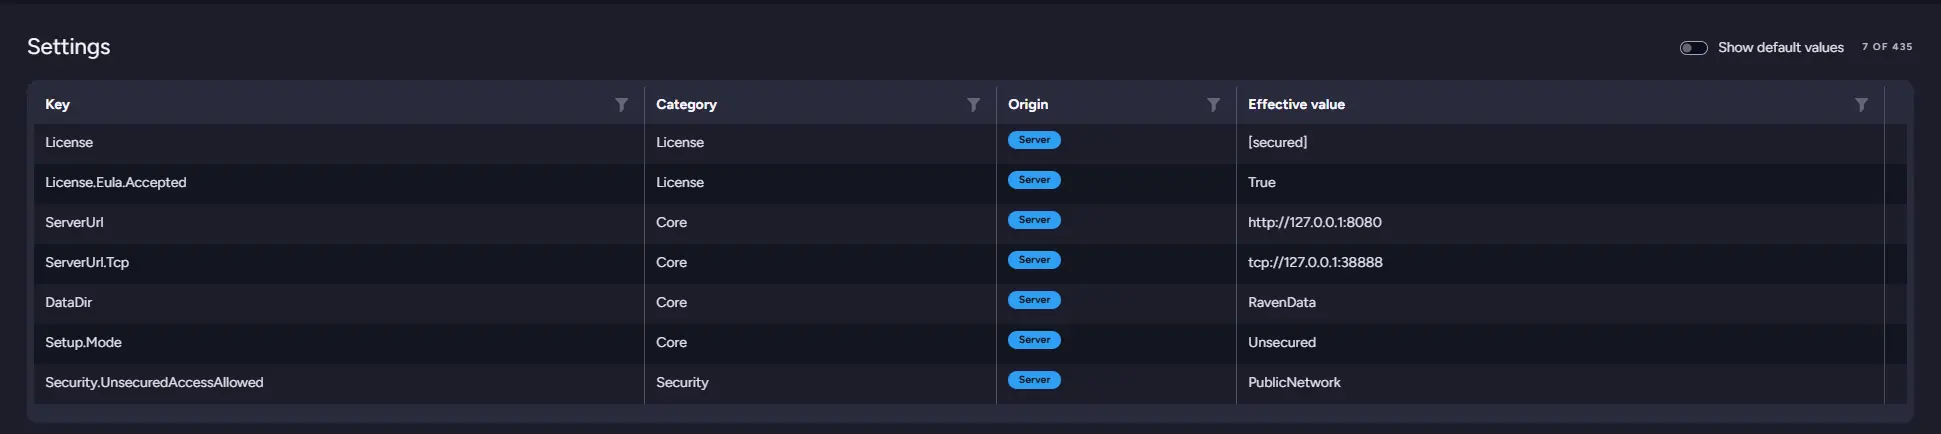
Settings shows the database's effective configuration on the selected node, as a searchable, sortable table with columns for Key, Category, Origin, and Effective value. The effective value is resolved the way RavenDB resolves it: a database override wins over a server setting, which wins over the built-in default. The Origin column tells you which of those three each value came from, and secured values such as the license key show as [secured] rather than their contents. Defaults are hidden by default, so the table shows only what has been customized, and a counter like 7 of 435 tells you how few of the total settings that is. A "Show default values" toggle reveals the rest. Read it two ways:
- Scan the customized settings, since a value someone changed is a likely explanation for behavior that surprises you. The security keys are worth a specific look: a Setup.Mode of Unsecured or a Security.UnsecuredAccessAllowed of PublicNetwork tells you at a glance how the server is exposed.
- Switch nodes to compare the same setting: a node with a different effective value for something that should be uniform is a configuration drift worth flagging.
Diagnostic cheatsheet
| Symptom you see | Panel that answers it | What the signal actually means |
|---|---|---|
| "No commits for over 2 minutes" raft warning | Cluster > Cluster Raft Debug | On current builds, compared against the snapshot's own most-recent commit time, not your wall clock. A quiet warning on a healthy package is correct; a flag means a node lagged its peers within the capture. |
Nodes status shows 2/3 online, warning color | Cluster > Cluster Overview | Inferred, not reported. Total comes from the node roster; "online" counts only nodes whose detail was captured. A missing node was unreachable at capture time. |
| Short issue list, but something feels incomplete | Analysis errors banner (all contexts) | One or more analyzer components failed to parse their slice. The reading is partial; expand the stack traces before trusting the result. |
| Database stats look normal | Database > Database Overview (indexing-errors tile) | A nonzero indexing-errors count means an index is throwing. Follow it to Index Errors, then Index Definitions, then Indexing Performance. |
Observer log labelled latest N shown | Cluster > Cluster Observer Decisions | The most recent slice, newest first, not the beginning of the log. For origins of a slow problem, the full log holds more. |
Habits to carry into the next package
- Check analysis errors first. Failed components mean incomplete results.
- Trust inferred values, but know how they are calculated.
- Reuse your live-view knowledge. Same tools, package data.
- Use overview tiles as pointers. Go one panel deeper.
- Trust mechanisms, not appearances. The tool can mislead too.