Cloud: Maintenance & Troubleshooting
Overview
Our products come equipped with advanced monitoring system that track critical performance metrics to ensure optimal operation. Each product may display one or more of the following labels, providing real-time insights into its current status.
Labels
| Label | Description |
|---|---|
| Node not responding | Product is currently not responding to input or commands. It suggests that the system may be experiencing a critical issue or is in an unresponsive state. This may be caused by high CPU or IO usage, thrashing, cloud provider hardware failure or application errors. |
| High CPU usage | Product is experiencing a high level of CPU utilization. It suggests that the product's processor is under heavy load, which may affect performance. |
| High IO usage | Product is experiencing high input/output operations, which may indicate heavy disk or network activity. High I/O usage can slow down data processing and affect overall system performance, necessitating optimizations or resource upgrades. Sometimes might be caused by thrashing (excessive swapping due to lack of memory). |
| Low memory | Product is running low on available memory. It warns that the system may be close to using all its RAM, which can impact its ability to handle additional tasks. Low memory conditions can cause applications to slow down or crash, indicating a need for memory optimization or an increase in RAM capacity. |
| CPU Credits are low | Product is running low on CPU credits (only on burstable instances). Low CPU credits can lead to reduced processing power, affecting performance. It may require adjusting resource allocation or upgrading to a higher credit tier. |
| Free disk space - 10% left | Product's available disk space is below 10%. |
| Free disk space is very low | Product's available disk space is below 7%. |
| Low uptime - below 15 minutes | Product's uptime has been below 15 minutes for at least 30 minutes. |
| Low uptime - below 2 hours | Product's uptime has been below 2 hours for at least 4 hours. |
| Low uptime - below 12 hours | Product's uptime has been below 12 hours for at least 24 hours. |
| Low uptime - below 48 hours | Product's uptime has been below 48 hours for at least 96 hours. |
Cluster Health
Cluster Health helps keep your cluster healthy by providing suggestions and incidents history.
This dashboard has four separated sections:
Nodes Availability
The Nodes Availability section shows the availability status of each node within your cluster. It provides a real-time, visual overview of how reliably each node has been operating in the current month.
Each node is represented by a gauge showing its availability percentage, helping you quickly assess the overall health of your system. The availability is calculated based on whether the node has been up and responsive.
Availability Status Thresholds
Each node's status is color-coded based on its availability percentage:
| Availability | Status | Color |
|---|---|---|
| > 99.9% | Healthy | 🟢 Green |
| 95% – 99.9% | Degraded | 🟡 Yellow |
| < 95% | Critical | 🔴 Red |

These thresholds help you identify which nodes might require attention:
- Healthy nodes have consistently high uptime and are performing reliably.
- Degraded nodes may have experienced occasional downtime or disruptions.
- Critical nodes have had significant availability issues and may require immediate investigation.
Incidents History
The RavenDB Cloud monitoring system tracks incidents and cluster performance.
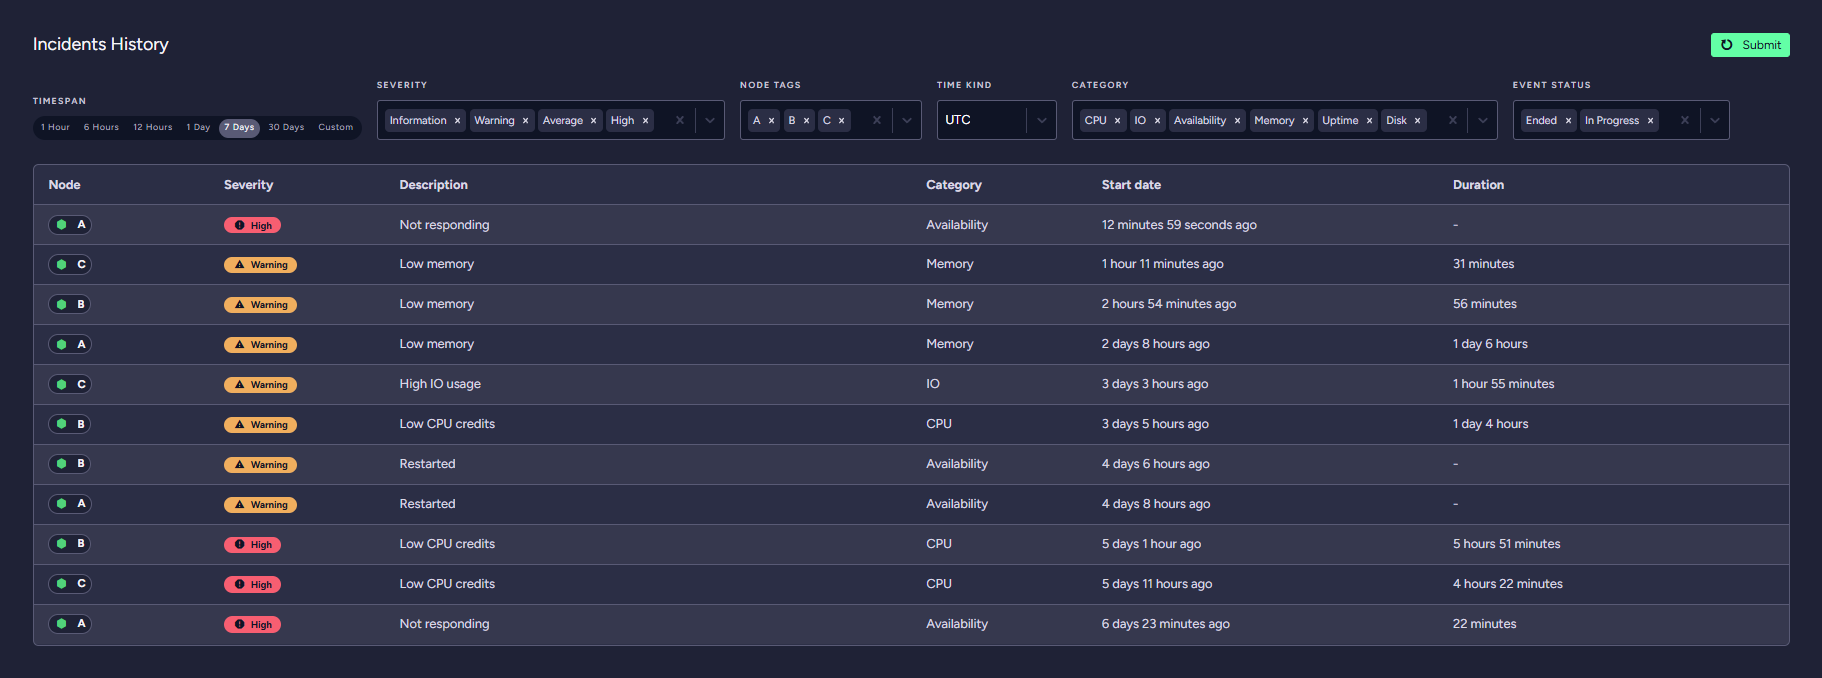
This section lets you analyse your cluster incidents for a selected time period, cluster node, severity, category and event status.

Categories and their descriptions
Incidents are split into six categories. Description column contains additional information about the incidents.
| Category name | Description |
|---|---|
| Uptime | Product's uptime has been below a specified time. |
| Memory | Product is running low on available memory. |
| CPU | Product is running low on CPU credits or experiencing a high level of CPU utilization. |
| Disk | Product's available disk space is low. |
| IO | Product is experiencing high input/output operations. |
| Availability | Product is currently not responding to input or commands or has been restarted. |
Suggestions
This section displays suggestions for a selected cluster node based on incident trends.

Suggestions are generated based on a 60-day period divided in half.
First period (hereinafter referred to as previous period) lasts from now - 60 days to now - 30 days.
Second period (hereinafter referred to as current period) lasts from now - 30 days to now.
Suggestion types
Cluster Health is able to generate suggestions for five usage areas:
- High CPU usage
- High IO usage
- Low memory mode
- Low CPU credits
- Server restarted due to Out of Memory
Analyses
Suggestions are generated using three types of analyses for specific suggestion types:
| Analyse type | Applicable to | Description |
|---|---|---|
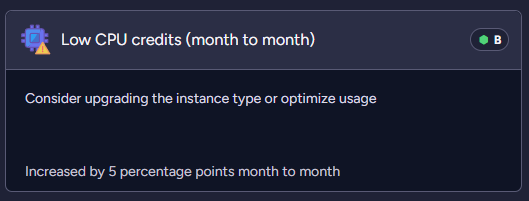
| Current period above previous period by percents | High CPU usage, High IO usage, Low memory mode, Low CPU credits | The duration of a specific event was longer in the current period than in the previous period. |
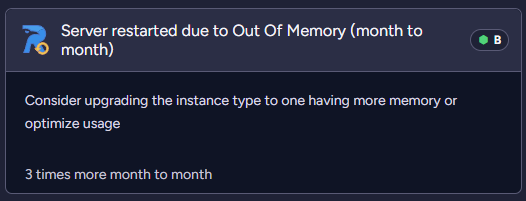
| Current period above previous period by numbers | Server restarted due to Out of Memory | The number of occurrences of a specific event was higher in the previous period than in the current period. |
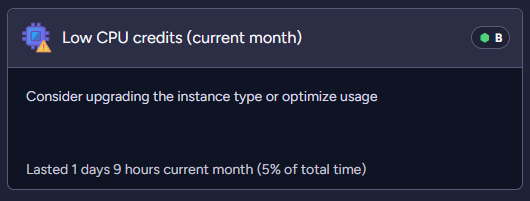
| Current period above threshold by percents | High CPU usage, High IO usage, Low memory mode, Low CPU credits | The duration of a specific event in the current period was longer than the threshold (5%). |
Below examples of the suggestions with the analyses:


Product changes in time
This view shows changes in product type over time. Changes can be presented as a graph or a table.

