Ongoing Task Stats: SQL ETL Stats
-
Studio's Ongoing Task Stats view draws an activity track for each active ongoing task of the currently selected database, and populates the track with operation bars that report individual task operations.
Learn more about this view in the Ongoing Task Stats article. -
See below how to read the activity track drawn for an SQL ETL task.
-
SQL ETL is a process that reads data from a RavenDB database, transforms it, and stores it in an SQL database.
-
In this article:
The collapsed track
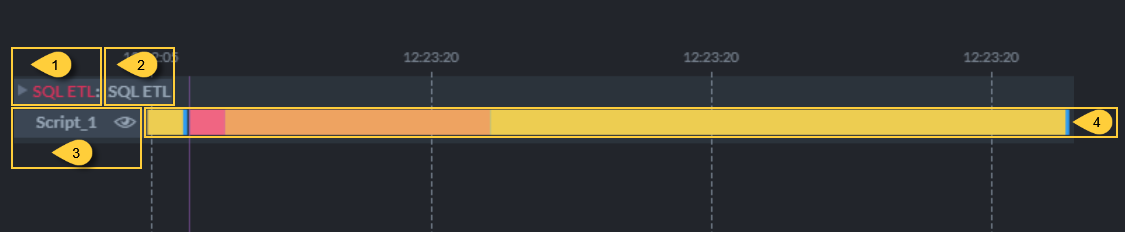
-
Task Type
Click the track label or bar to expand the track and display additional operation bars.
When expanded, collapse the track by clicking its label or arrow indicator. -
Task Name
The name given to the ETL task. -
Transform Script
The name of the transformation script.
Click the eye icon to display the script. -
Task Bar
- Hovering over the bar displays the details of the ETL batch.
- Dragging the bar slides the graph along the time axis.
- Rolling the mouse wheel zooms in or out.
The expanded track
Expanding an SQL ETL track reveals the operations included in each batch.
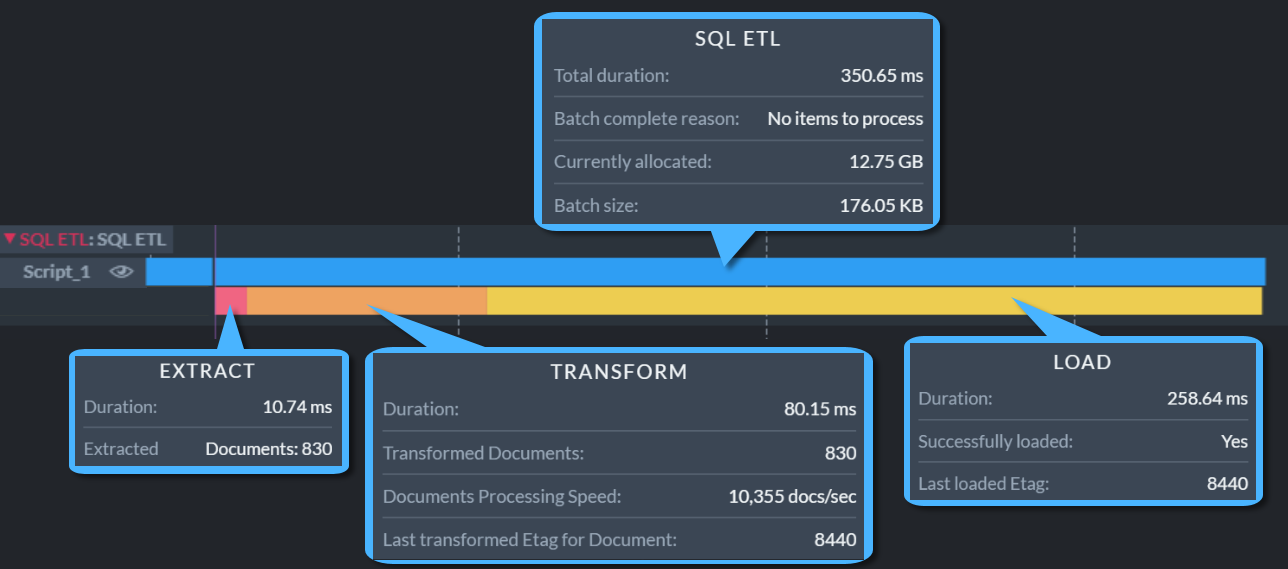
Hover above an operation bar of an expanded track to see the bar's properties as depicted below.
-
SQL ETL bar.
The topmost bar, reporting properties measured over the whole batch:- Total duration
The duration of the whole batch, covering the extract, transform, and load operations. - Batch complete reason
The reason the batch ended, e.g., "No items to process" or "Stopping the batch because maximum batch size limit was reached". - Currently allocated
The amount of memory the server allocated to handle the task. - Batch size
The size of the data the batch carried. - ETL task has Transform errors or ETL task has Load errors
Potential error notices, reported only when the transformation script failed on at least one item or when the batch's load did not succeed, pointing to the notification center for further details.
- Total duration
-
Extract bar.
Properties measured while extracting the items from the source database:- Duration
The time it took to extract the items. - A count for each item type the batch carried, so the number of lines varies from batch to
batch. The image above shows Extracted Documents.
The item types are documents and counter groups. - Last filtered out Etag for Document
The etag of the last item the transformation script filtered out, reported per item type.
- Duration
-
Transform bar.
Properties measured while running the transformation script over the extracted items:- Duration
The time it took to run the script. - Transformed Documents
The number of items the script processed, reported per item type. - Documents Processing Speed
The average number of items the script processed per second, reported per item type. - Transformed Documents tombstones
The number of tombstones the script processed, reported per item type. - Transformation error count
The number of items the script failed on. - Last transformed Etag for Document
The etag of the last item the script processed, reported per item type.
- Duration
-
Load bar.
Properties measured while loading the transformed items into the destination SQL tables:- Duration
The time it took to load the items. - Successfully loaded
Yeswhen the items reached the destination,Nowhen the load failed. - Last loaded Etag
The etag of the last item loaded.
- Duration