Studio: Query View
-
Use Studio's Query view to write and run RQL queries on a database, and to examine the query results.
-
Queries you save are kept in your browser's local storage, and can be loaded only in this browser.
-
You can set query options for the view, e.g., to prevent queries from creating auto indexes, or to display the index entries that match a query rather than the matching documents.
-
In the query results area, you can examine the index that served the query, view the query statistics, delete the documents that match the query, and export the results to a CSV or a JSON file.
The result columns can also be customized, and each result can be previewed and its values copied. -
Time series query results can be displayed as a graph over time, and spatial query results on a world map.
These displays are described in Querying Time Series and Spatial Queries Map View. -
In this article:
Query view
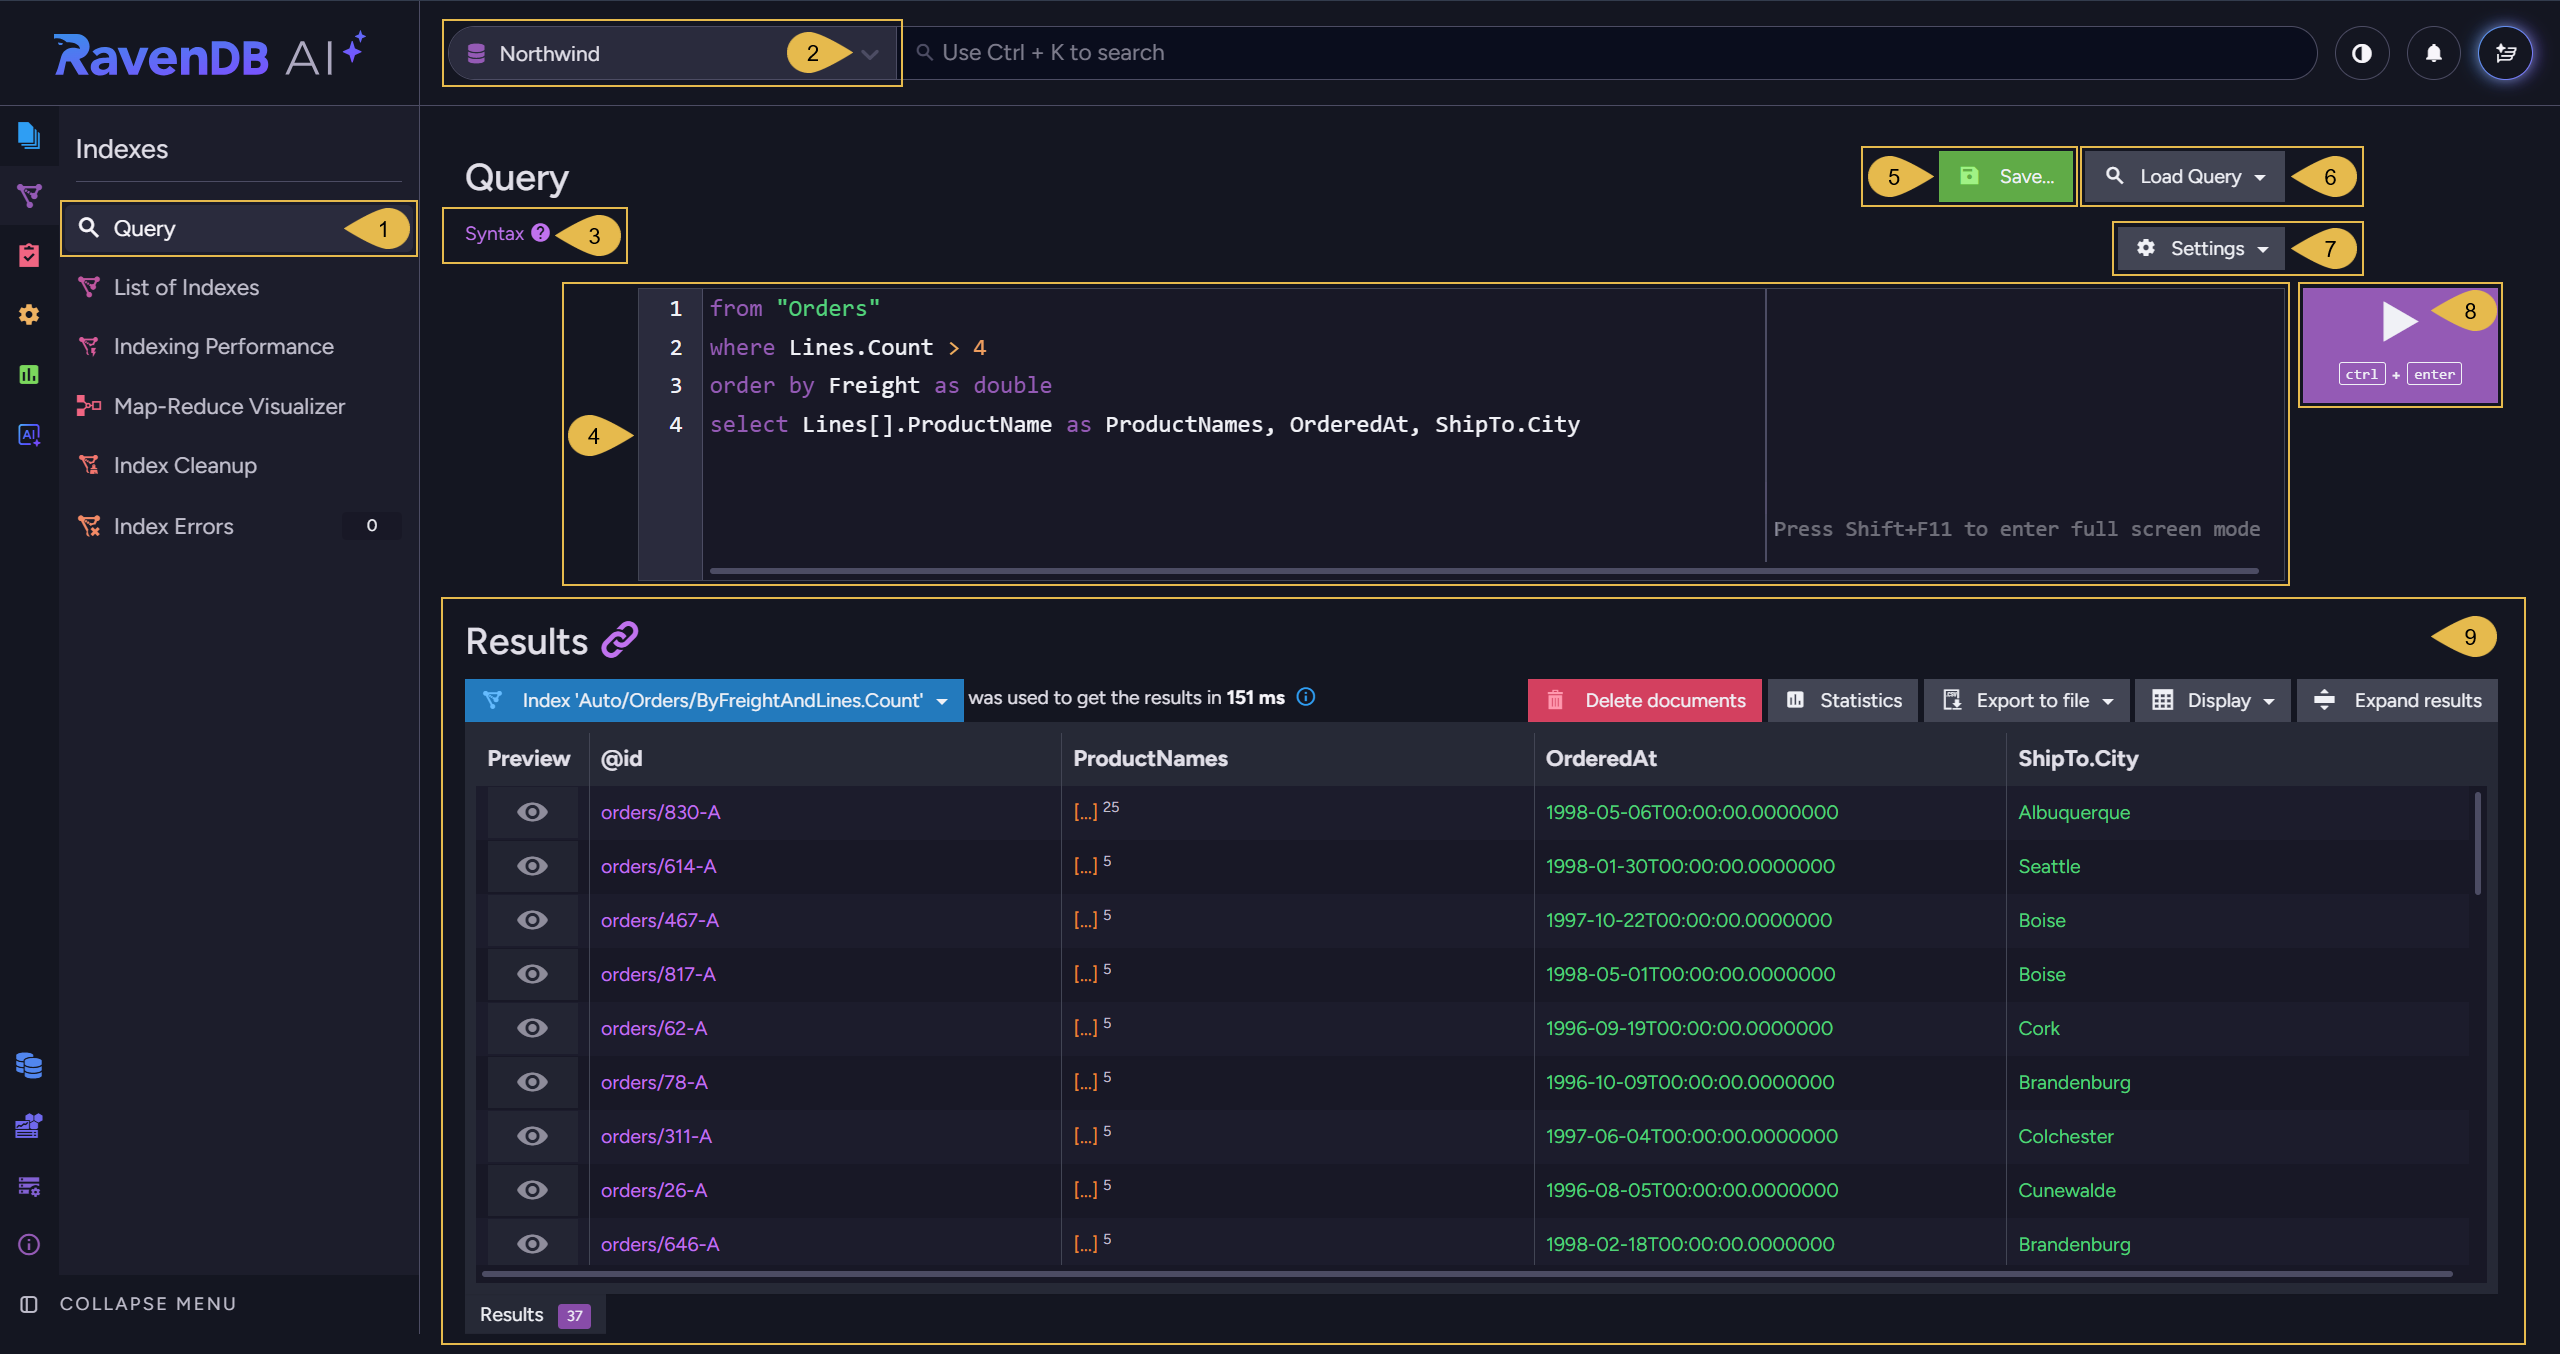
Use the Query view to write, save, and load queries, and to run queries with the options you set.
Indexes > Query
-
Query
Open the Query view. -
Database selector
Select the database to query. -
Syntax
Open a dialog with sample RQL queries. -
Query editor
Write your RQL query.
The editor offers auto-complete suggestions as you type. -
Save...
Save the query in your browser's local storage.
Click Save..., enter a name for the query, and click Save.
If a query with this name was already saved, you will be asked whether to overwrite the saved query.
-
Load Query
Open the list of saved queries.
In addition to queries you saved explicitly, the list holds the queries you recently ran, each namedRecent Queryand the name of the queried collection or index.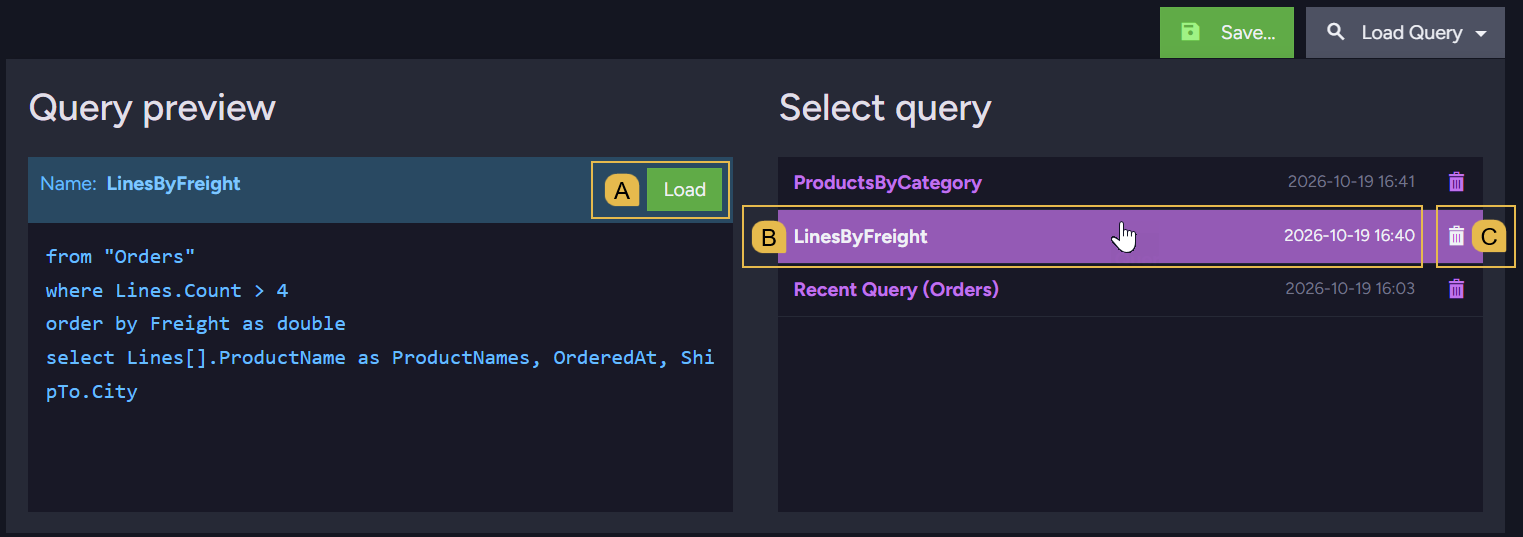
- A. Load
Load the query displayed in the Query preview area into the editor, and run it. - B. A saved query
Hovering over a query name displays the query in the Query preview area.
Click the query name to load the query into the editor and run it. - C. Delete
Delete the query.
You will be asked to confirm the deletion.
- A. Load
-
Settings
Set query options for this view.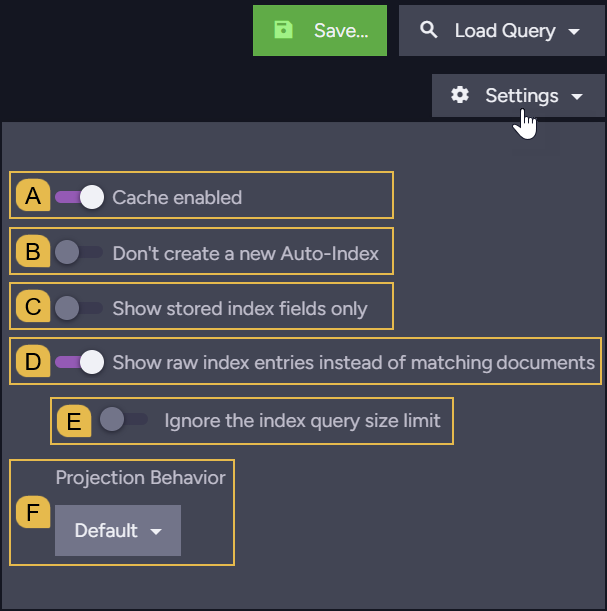
- A. Cache enabled
Enable or disable caching of query results. - B. Don't create a new Auto-Index
Enable to prevent queries from creating auto indexes.
When this option is enabled and no existing auto index fits a query, the query will fail.- The option's initial state is set in Studio configuration.
- C. Show stored index fields only
Enable to display only the fields stored in the queried index.
This option is disabled for queries executed over a collection (e.g.,from "Orders"). - D. Show raw index entries instead of matching documents
Enable to display the index entries that match the query, rather than the matching documents.- This option is disabled for queries executed over a collection (e.g.,
from "Orders"). - For map-reduce indexes and for indexes of counters or time series, the option is named Show raw index entries instead of index results, since the results of these indexes are not documents.
- This option is disabled for queries executed over a collection (e.g.,
- E. Ignore the index query size limit
Enable to read the raw entries regardless of the index size.- This option appears while Show raw index entries is enabled.
- Each index uses one of RavenDB's two search engines, Lucene or Corax.
By default, a request to display the raw entries of a Lucene index that holds more than 524,288 entries will fail, since reading so many entries can take a long time and use a lot of memory.
Corax indexes have no such limit.
- F. Projection Behavior
Select the projection behavior, which determines whether the values of projected fields are retrieved from the index or from the documents.
Learn more in the "Projection behavior with a static-index" section of Project Index Query Results.
- A. Cache enabled
-
Run query
Run the query (or press Ctrl+Enter).
If the query runs for longer than 5 seconds, an Abort query button appears below the run button. -
Results
The results of the query you ran.
See Query results
Query results
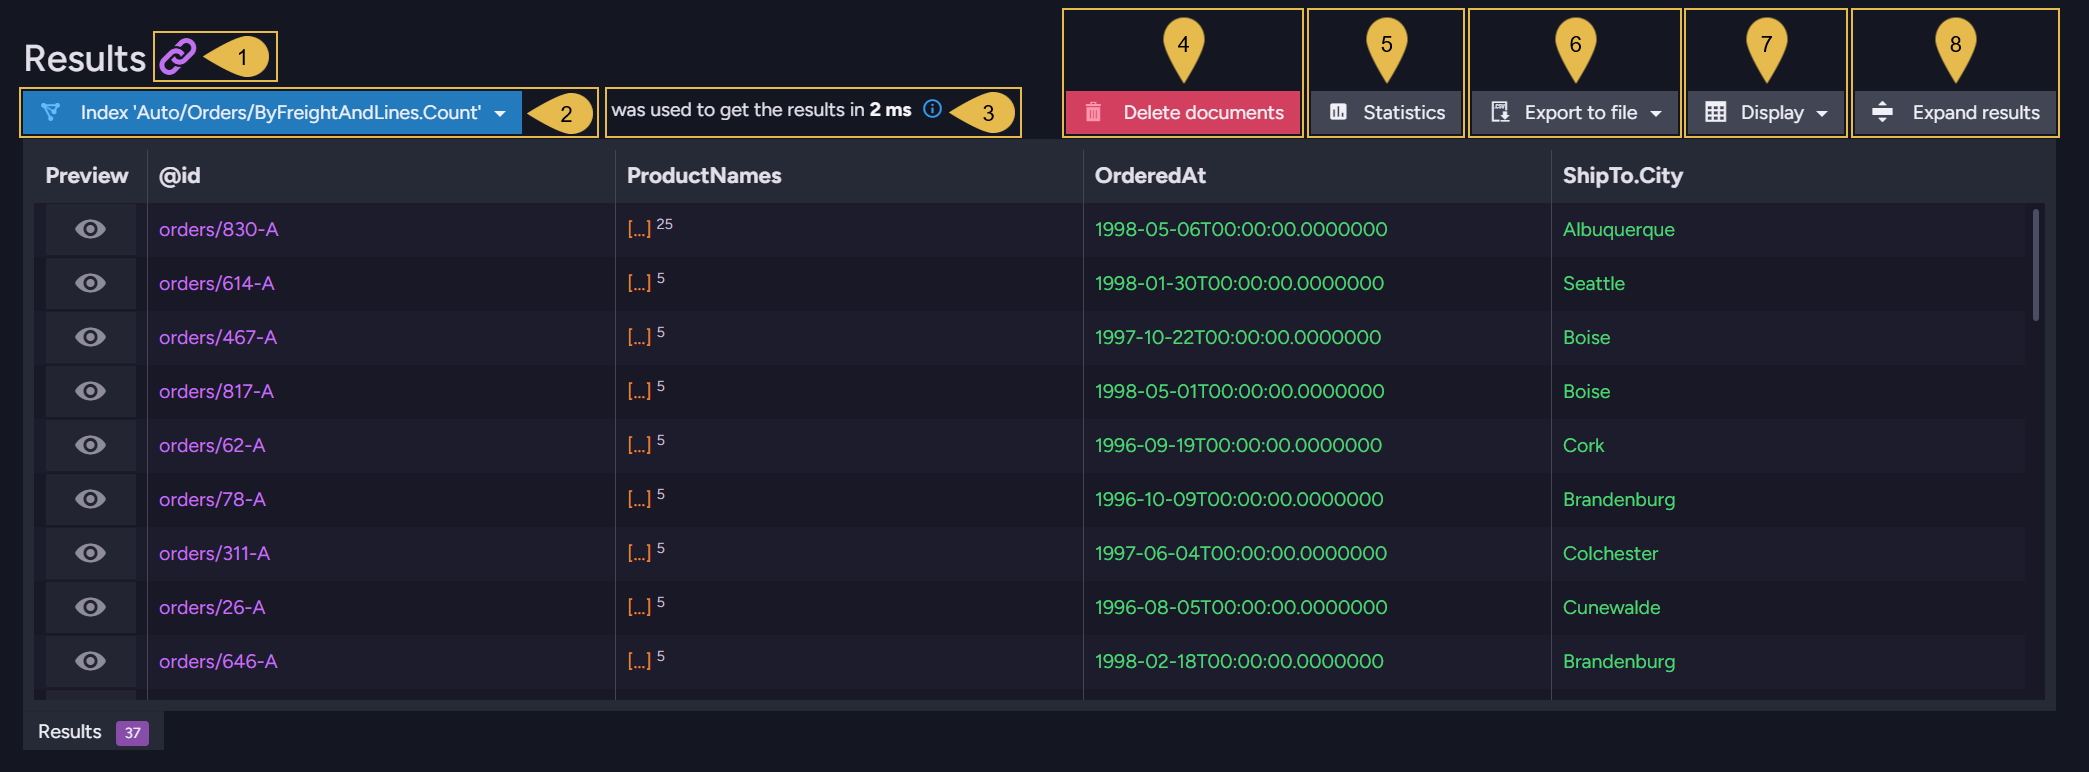
The results area displays the items the query returned, along with information about the query and controls you can use to work with these items.
-
Show raw output
Open the query's raw JSON response in a new browser tab. -
Index
The name of the index that served the query.
Click the index name to open a menu of actions related to the index.
For a query that retrieves a collection's documents without an auto index (e.g.,from "Orders"), the collection's name is displayed, with no menu.
Learn about the index used by each query type in Query overview.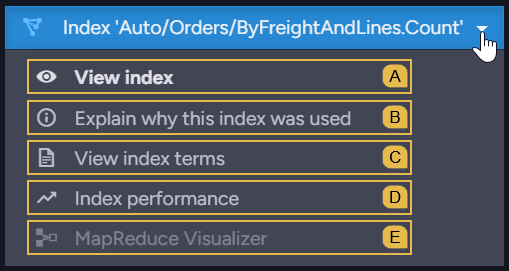
- A. View index
Open the index definition in the Edit Index view.
For a static index, the entry is named Edit index, and you can edit the index definition. - B. Explain why this index was used
For a query executed over a collection, RavenDB selects the auto index that serves the query.
Open a dialog that shows the selected auto index, and the other auto indexes RavenDB considered with the reason each index was rejected.
This entry is disabled for queries that specify an index (e.g.,from index "Orders/Totals"), since RavenDB uses the specified index and makes no selection. - C. View index terms
Open the Terms view, which lists the index fields and the terms the index stores for each field. - D. Index performance
Open the Indexing Performance view. - E. MapReduce Visualizer
Open the Map-Reduce Visualizer view.
This entry is available only for map-reduce indexes.
- A. View index
-
Query duration
The time it took to retrieve the query results.To see a breakdown of the query duration, add
include timings()to the query.
Learn more in Include Query Timings. -
Delete documents
Delete all the documents that match the query.
You will be asked to confirm the deletion.
This button is disabled when the query results are not documents (e.g., the results of a map-reduce index). -
Statistics
Open a dialog with the query statistics:- Total Results: the number of results the query returned.
- Status:
Staleif the index was stale when the query ran (some documents were not processed by the index yet),Up to dateotherwise. - Duration: the time, in milliseconds, it took to run the query.
- Index: the name of the index that served the query.
- ETag: the ETag of the query results, which RavenDB uses to tell whether the results have changed since the last retrieval.
-
Export to file
Export the query results to a file.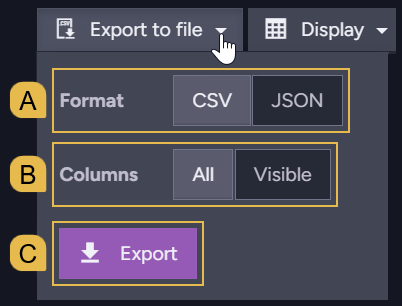
- A. Format
Select the file format: CSV or JSON. - B. Columns
Select All to export all the result columns, or Visible to export only the columns currently displayed.
Custom columns are not exported. - C. Export
Download the exported file.
- A. Format
-
Display
Select the result columns to display, and add columns of your own.
See Customizing the result columns -
Expand results
Hide the query editor, so the results take up the whole view.
Click Collapse results to display the query editor again.
Customizing the result columns
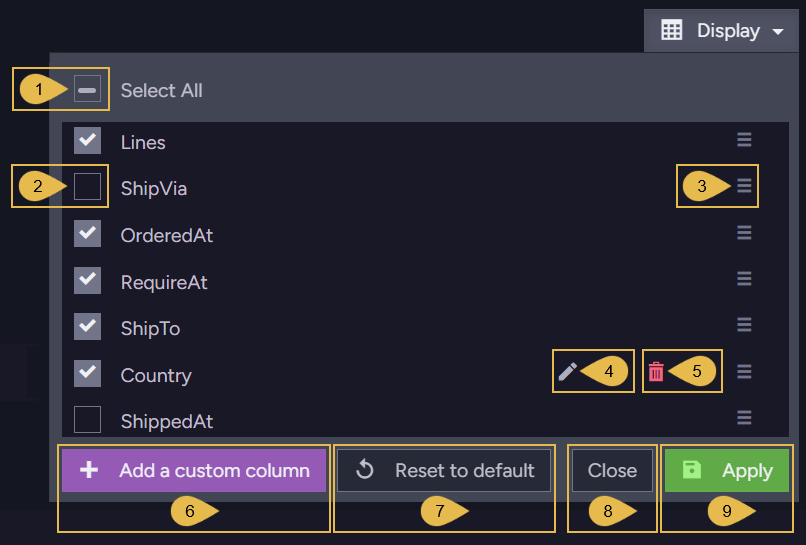
Use the Display dialog to select the result columns to display, set the order of the columns, and add columns of your own.
To open the dialog, click Display in the results area.
-
Select All
Clear all the column checkboxes, or select all the checkboxes when none is selected.
When only some of the columns are selected, the Select All checkbox is partially checked. -
Column checkbox
Select or clear the checkbox to display or hide the column. -
Drag handle
Drag the handle up or down to move the column to another position among the result columns. -
Edit
Edit the binding and alias of a custom column, using the custom column form (see Add a custom column below).
This icon appears only on custom columns. -
Remove
Remove a custom column.
This icon appears only on custom columns. -
Add a custom column
Open the custom column form, to add a column whose values are returned by a JavaScript expression you define.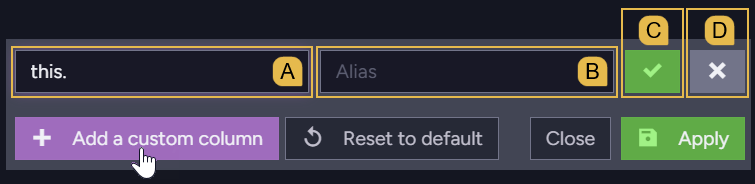
- A. Binding
Enter a JavaScript expression that returns the column's value for each result, usingthisto refer to the result. e.g.:this.ShipTo.Country - B. Alias
Enter the column's title. - C. Add
Add the column to the results.
The column is displayed right away, without clicking Apply. - D. Cancel
Close the form without adding the column.
- A. Binding
-
Reset to default
Restore the default result columns and their default order. -
Close
Close the dialog without applying your changes. -
Apply
Apply your changes and close the dialog.
This button is enabled only when at least one column is selected.
Inspecting result values
Use the results table to preview results, open result documents, and examine or copy the values in the table cells.
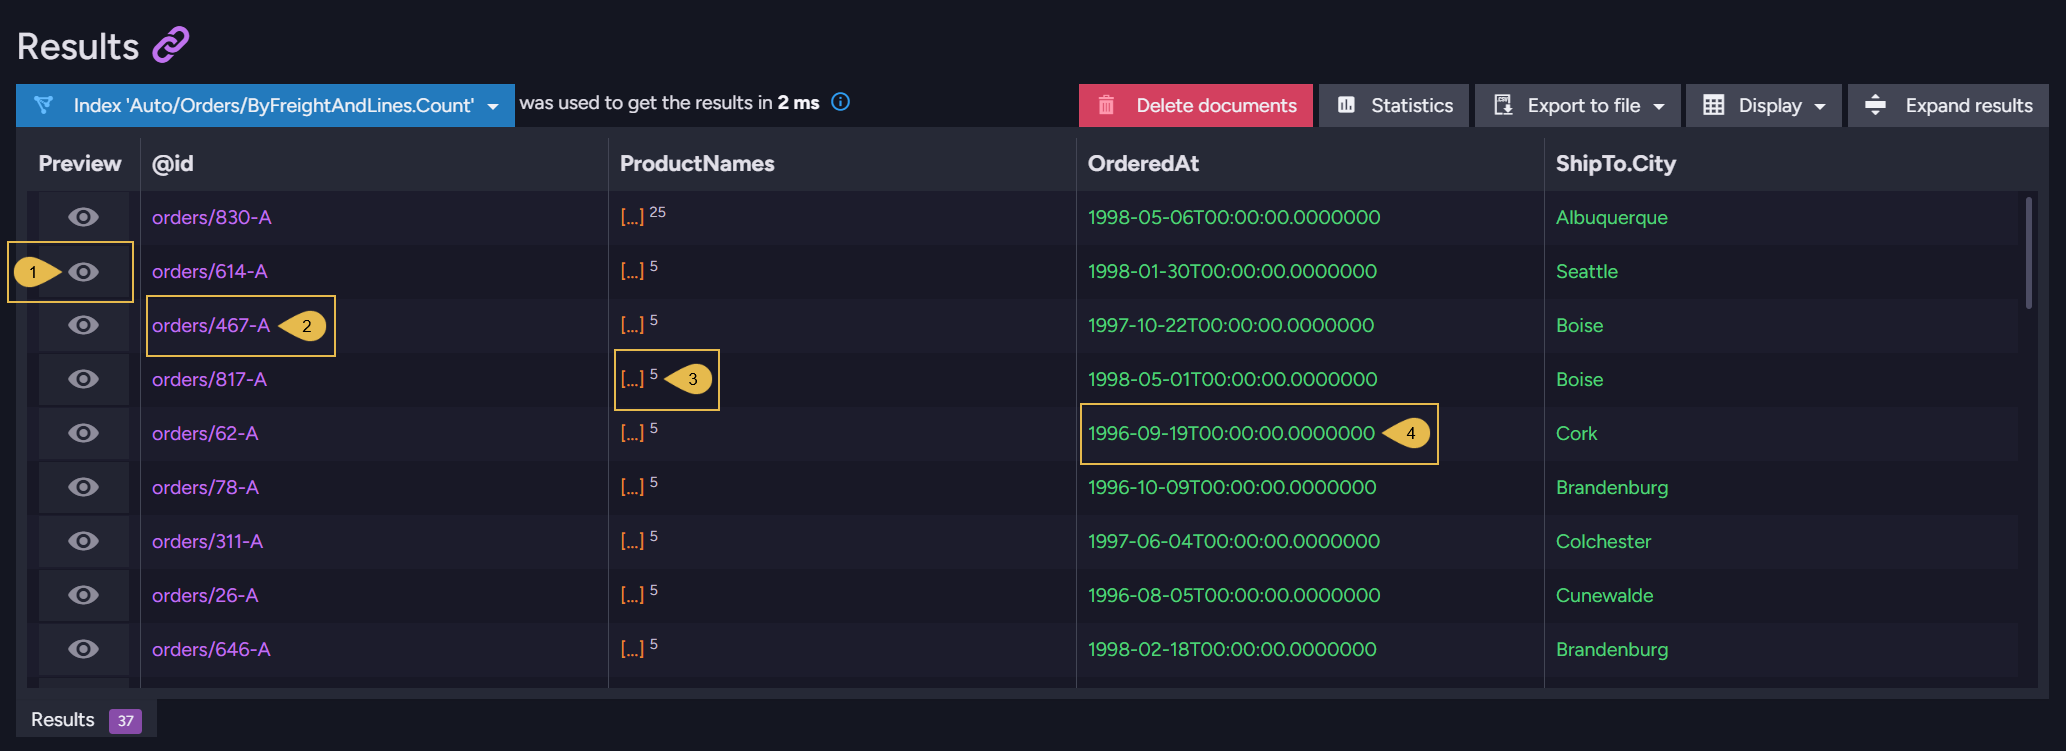
-
Preview
Open a dialog that displays the result in JSON format. -
Document ID
Click the document ID to open the document in the Document view.
Hovering over the ID displays the ID in a popup, with a Copy to clipboard button.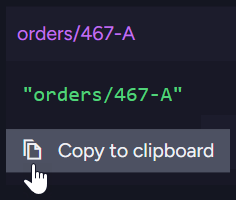
-
Array value
An array is displayed as[...], with the number of the array's items next to the brackets.
An object is displayed in a similar way, as{...}with the number of the object's properties.
Hovering over an array or an object displays the full value in a popup, with a Copy to clipboard button.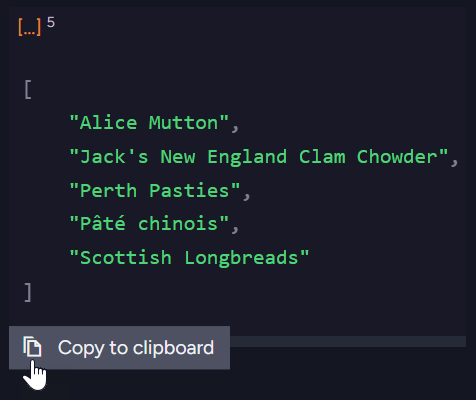
-
Text value
Hovering over a value displays the full value in a popup, with a Copy to clipboard button.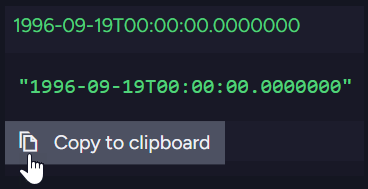
Additional query types
The Query view also displays the results of these query types:
- Time series queries
The results of a time series query can be viewed as a table or as a graph over time.
See Querying Time Series - Spatial queries
The results of a spatial query can be displayed on a world map, in the Spatial Map tab.
See Spatial map view - Counter queries
A query can select counter values, which are then displayed in the query results.