Task errors: Studio views
-
Tasks>Task Errors
Open theTask Errorsview from theTasksmenu to inspect errors raised by ETL and AI tasks.
You can browse all errors in a unified list or group them by task, apply various filters, select an error to view it in detail, and see how task health is impacted by recent errors. -
AI Hub>AI Task Errors
TheAI Task Errorsview, opened from theAI Hub, is a pre-filtered subset of theTask Errorsview.
Use this view to inspect errors raised byEmbeddings GenerationandGenAItasks. -
Both views display the same errors for listed tasks; deleting a task's errors from one view is reflected in the other.
-
Tasks>Ongoing Tasks
Each ETL and AI task bar on theOngoing Tasksview shows the task's health state and error count; expanding the bar reveals additional detail. -
To learn about task errors and how they impact task health, see the Overview page.
-
In this article:
Task Errors view
In its default layout, Task Errors groups errors into per-task segments, each showing the
task's errors in a sortable table.
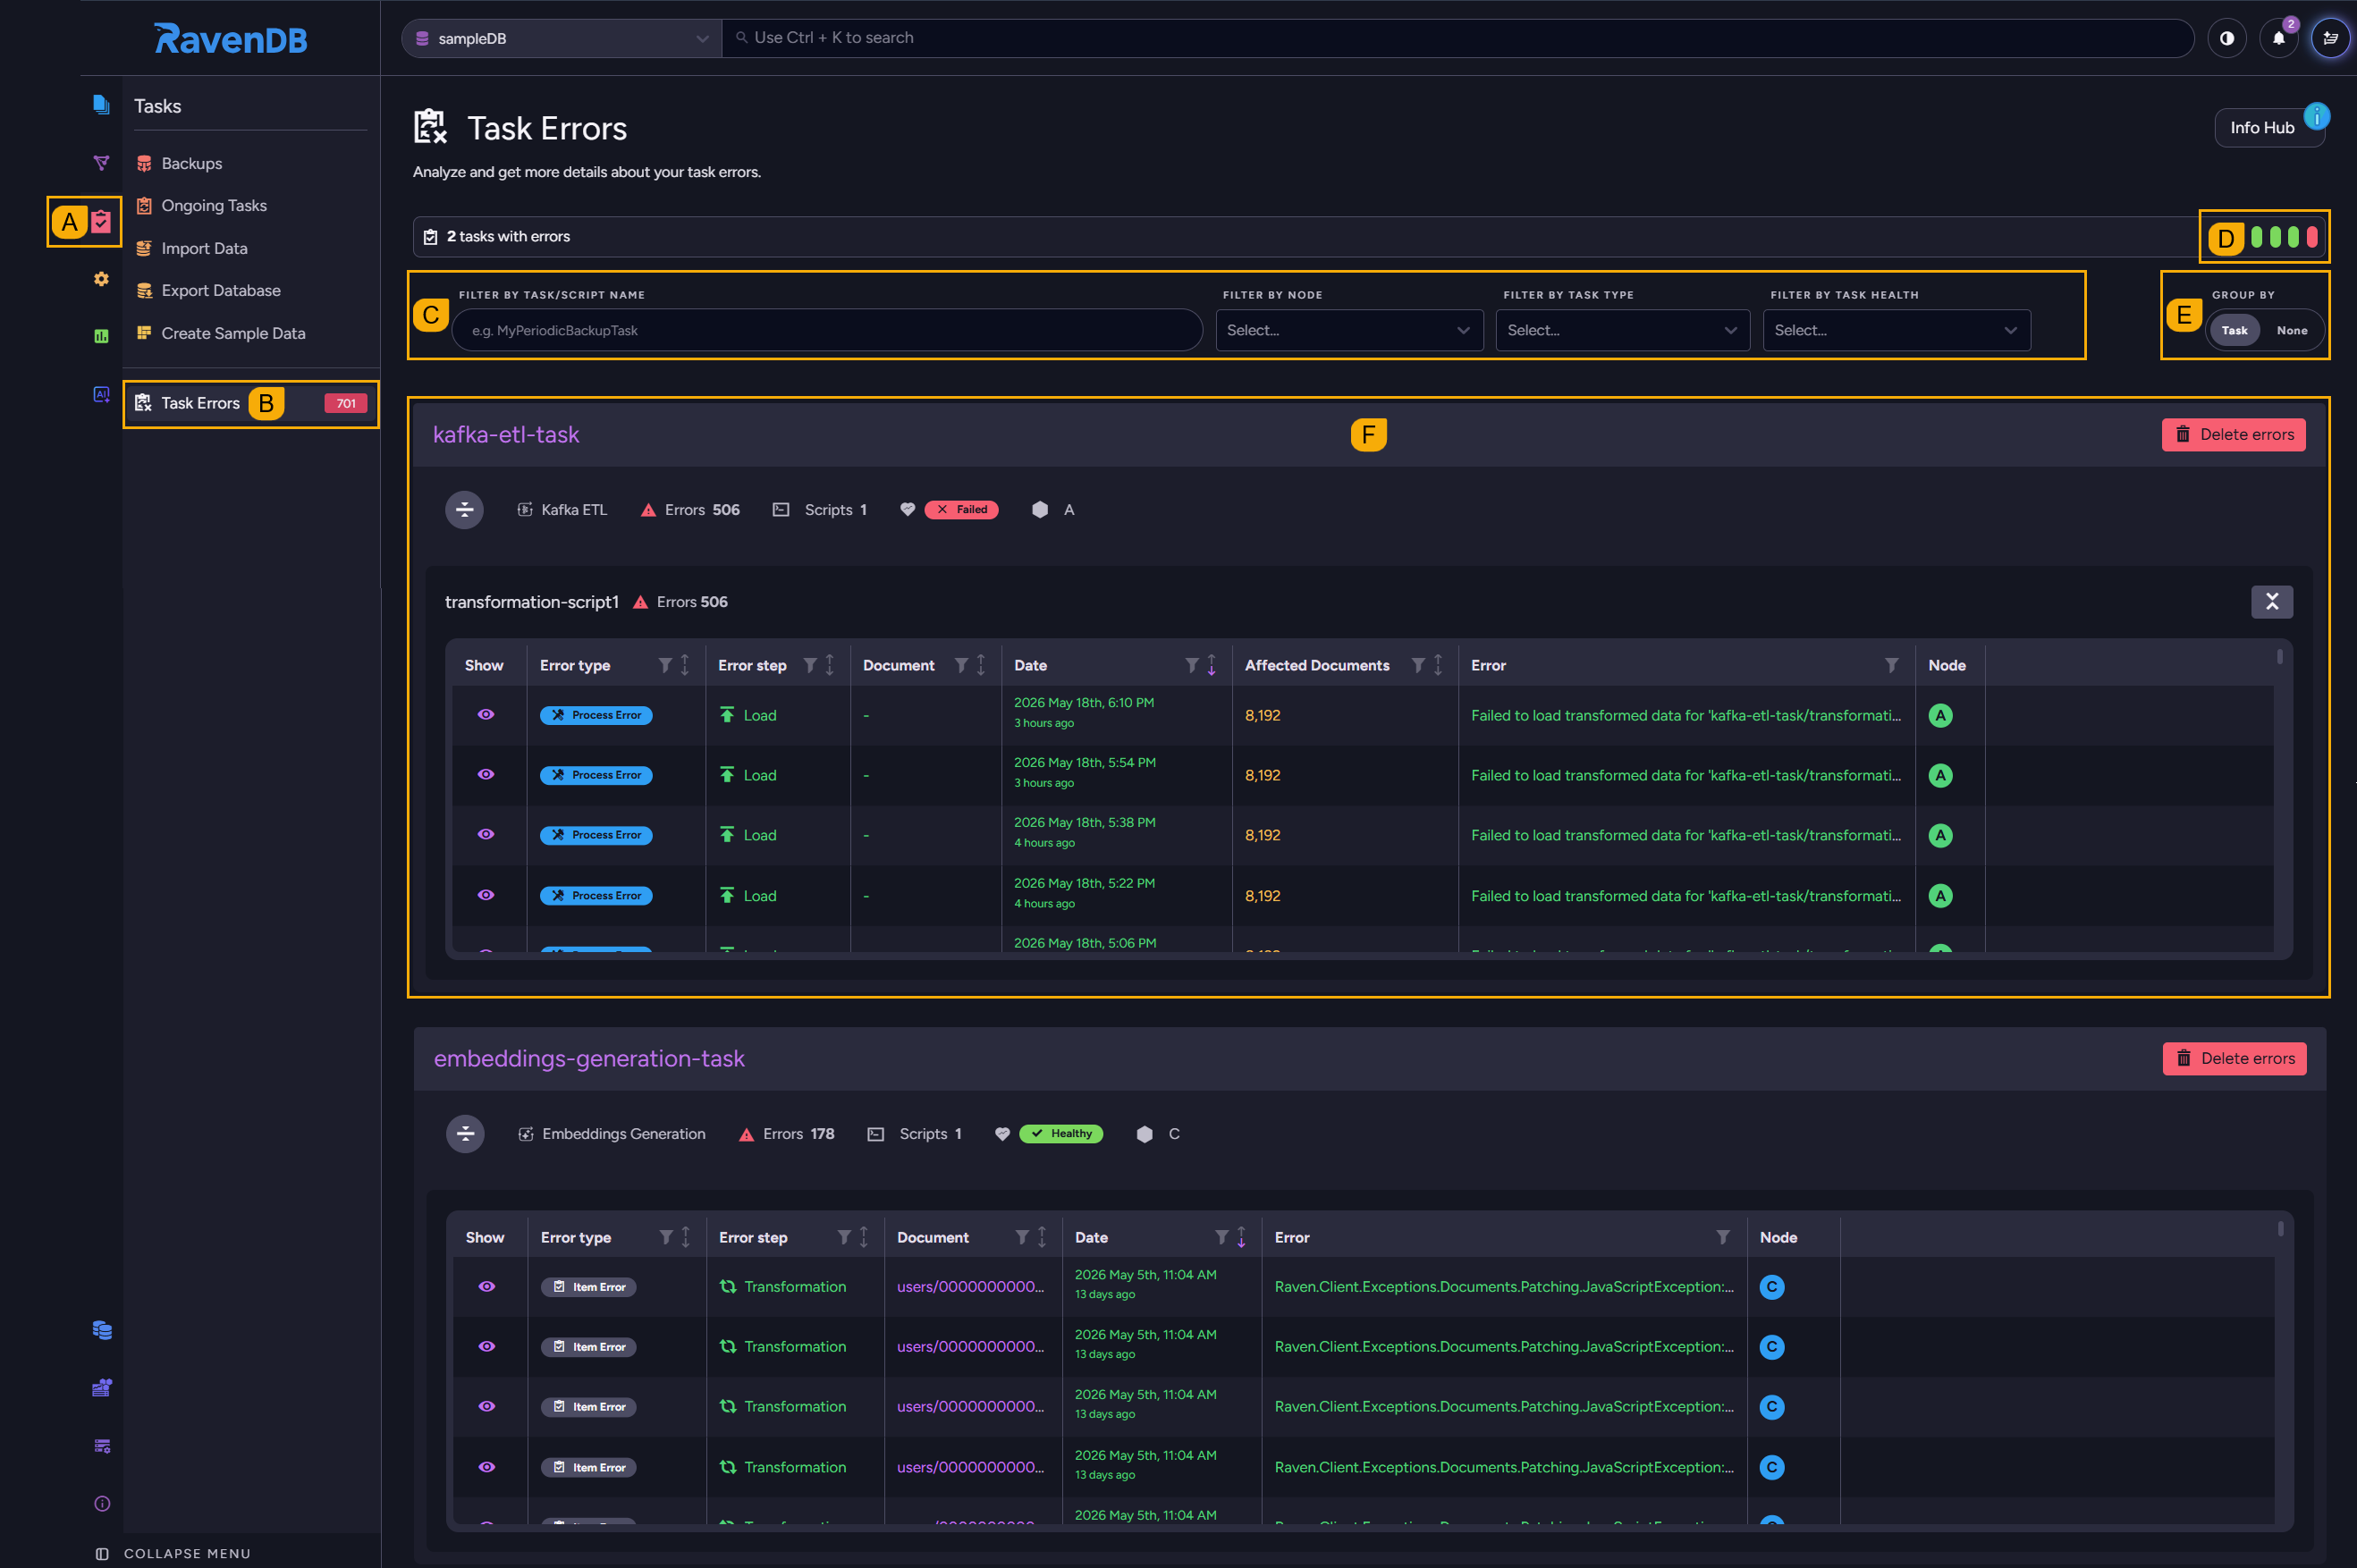
Opening the view
Open the Task Errors view from the Tasks menu. By default it will open with no filters applied,
showing a segment for every ETL or AI task that currently has any errors.
-
A. Click to open the Tasks menu.
-
B. Click to open the Task Errors view.
-
C. Task filters (see below).
-
D. Task health indicators (see below).
-
E. Toggle to group errors by task or display them in a unified list.
-
F. Task errors (see below).
Task filters
Use the filters bar to narrow the listing to specific tasks and errors.

-
Filter by task/script name
Type a task or script name to narrow the listing to matching tasks. -
Filter by node
Pick one or more cluster nodes to show only the errors raised on the selected nodes. -
Filter by task type
Pick one or more task types (e.g., Kafka ETL) to show only the errors raised by the selected types. -
Filter by task health
Pick one or more health states to show only tasks currently in the selected states.
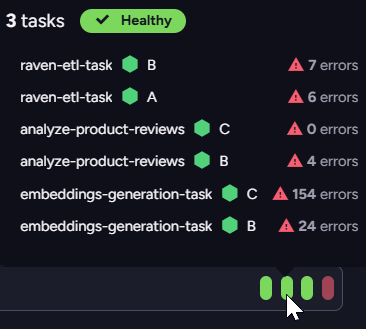
Task health indicators
The indicators' colors represent task health states: Green for Healthy, yellow for
Impaired, and red for Failed.
- Hover an indicator to trigger a popup summary of tasks whose health currently matches the selected state.
- The summary lists only the node currently running the task and any nodes that recorded errors for it, with the error count per node.
Task errors
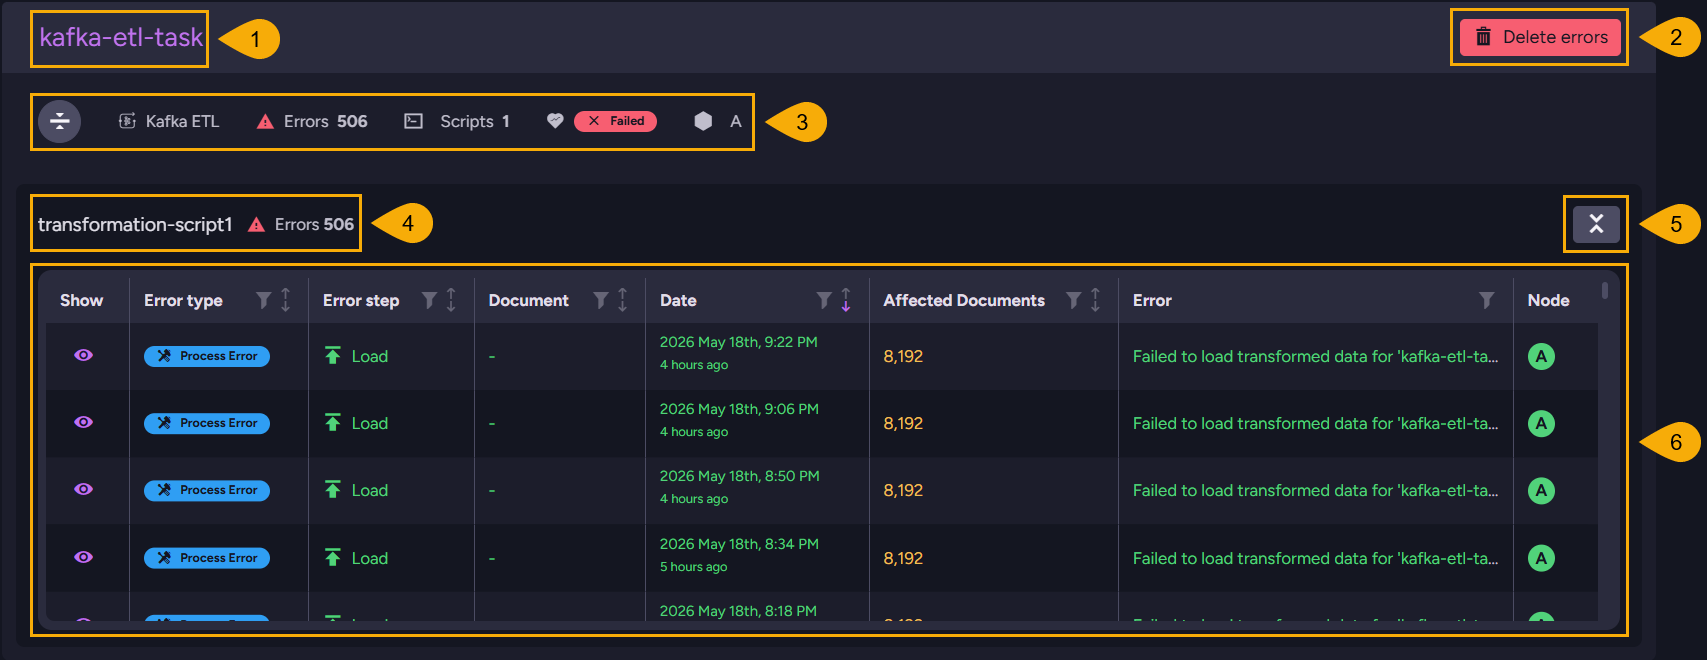
The image below shows one of the task segments displayed in the task errors view when errors are grouped by task.
-
Task name
The name of the ETL or AI task whose errors are displayed here. -
Delete errors
Click to remove all errors raised by this task, including both item and process errors.Deleting a task's errors does not, on its own, reset the task's health state.
Health is driven by the running error rate, not by the rows in the error tables.
A task inImpairedorFailedstate will recover only as new batches complete successfully and its error rate falls back below the configured thresholds.
See the Overview for more. -
Task metadata row
- A toggle to collapse or expand all errors related to this task.
- Task type.
- Error count for this task.
- The number of scripts that this task runs.
- Task's current health state (
Healthy,Impaired, orFailed). - Tag/s of the cluster node/s currently running the task.
-
Script sub-segment details
Errors for each script the task runs appear in their own sub-segment, with a header showing the script's name and error count and a toggle to collapse or expand the errors related to this script. -
Errors table
The script's errors, one row per error.-
Column headers
You can filter or sort the table by the content of each column, using the funnel (filter) or arrow (sort) icons at the column header. -
Showcolumn
Click the eye icon for a specific error to open an error-details dialog with the full error message. -
Error typecolumn
Marks the row asItem Error(a single document failure the task skipped past) orProcess Error(a batch-scope failure that may affect multiple documents). -
Error stepcolumn
The processing step the error occurred at:Configuration,Extraction,Transformation,Load,Persistence,Model Inference, orUnknown.
See the Error steps reference on the overview. -
Documentcolumn
For item errors, the ID of the document being processed when the error occurred, rendered as a hyperlink to the document.
For process errors, the column shows-because the error is not bound to a single document. -
Datecolumn
The error's creation timestamp, shown in date form and in relation to the current time (e.g., "4 hours ago"). -
Affected Documentscolumn
For process errors, the number of documents the failing batch attempted to process.
Empty for item errors. -
Errorcolumn
The error message, truncated to one line. -
Nodecolumn
The tag of the cluster node that recorded the error.
-
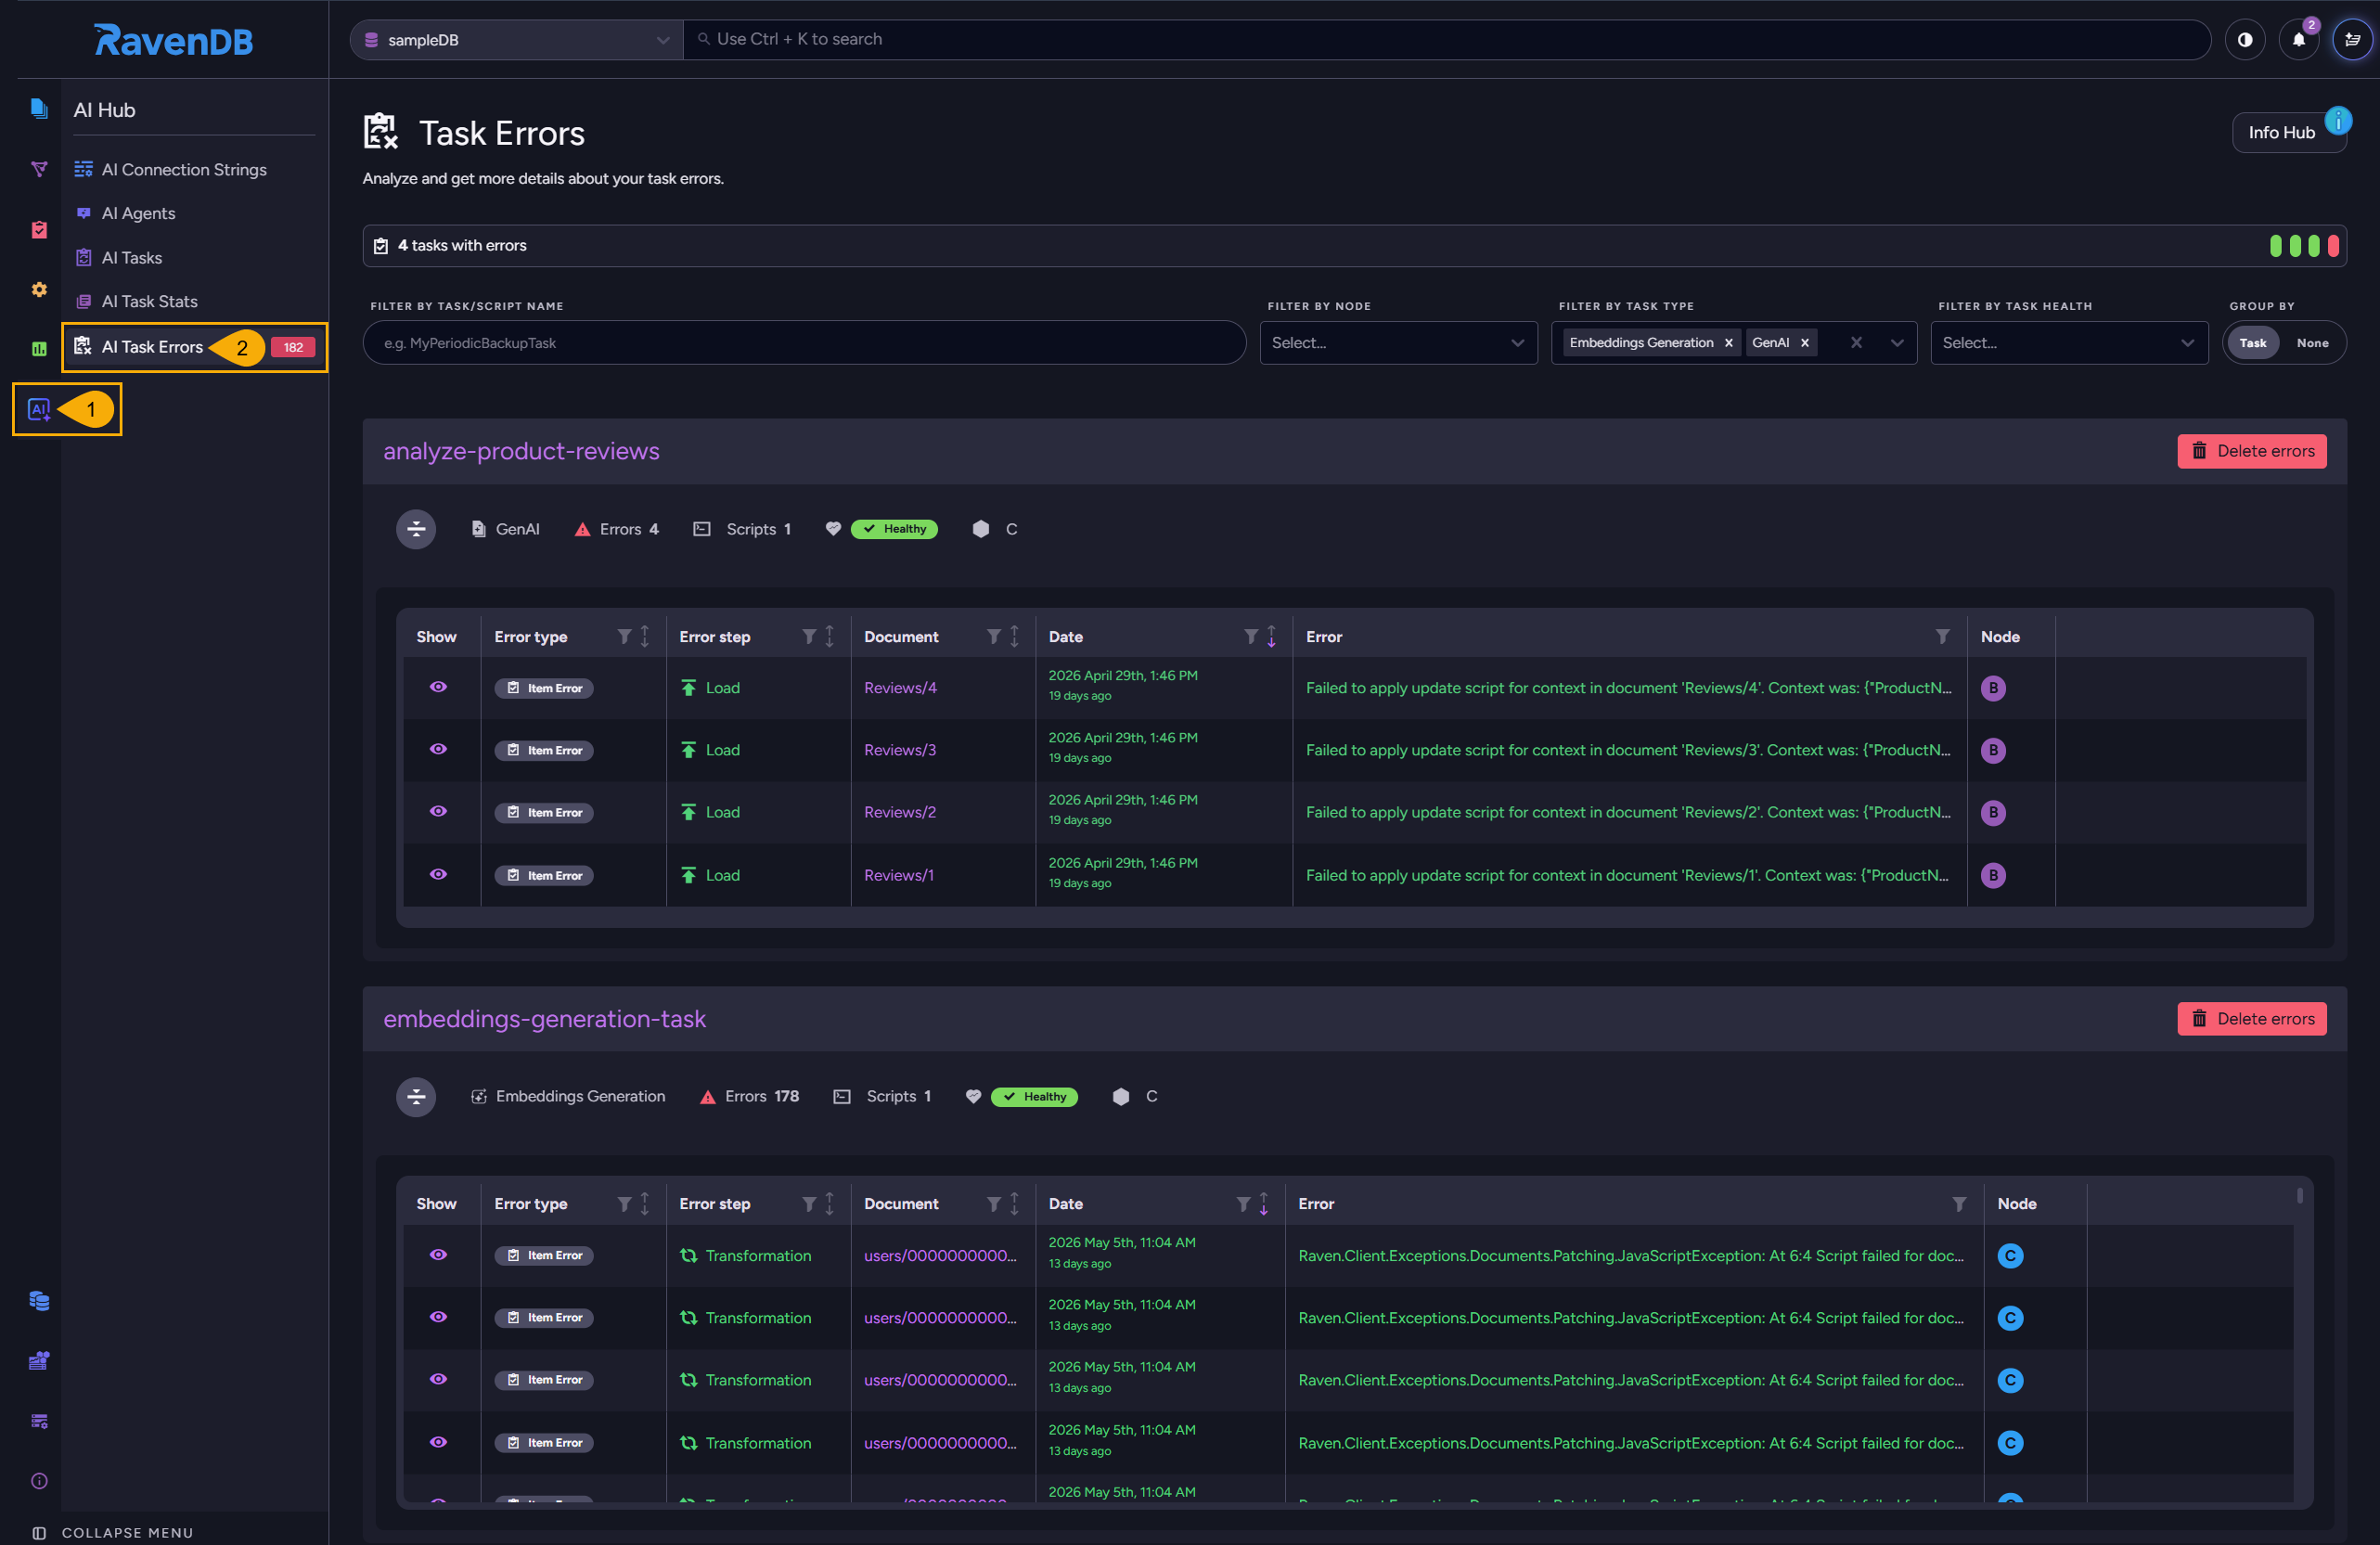
AI Task Errors view
The AI Task Errors view lists the same errors listed by the Task Errors view,
with the same layout, controls, and data, but applies a predefined filter to show only
Embeddings Generation and GenAI task errors.
All options documented under Task Errors view above apply here without change.
-
Click to open the AI Hub.
-
Click to open the AI Task Errors view.
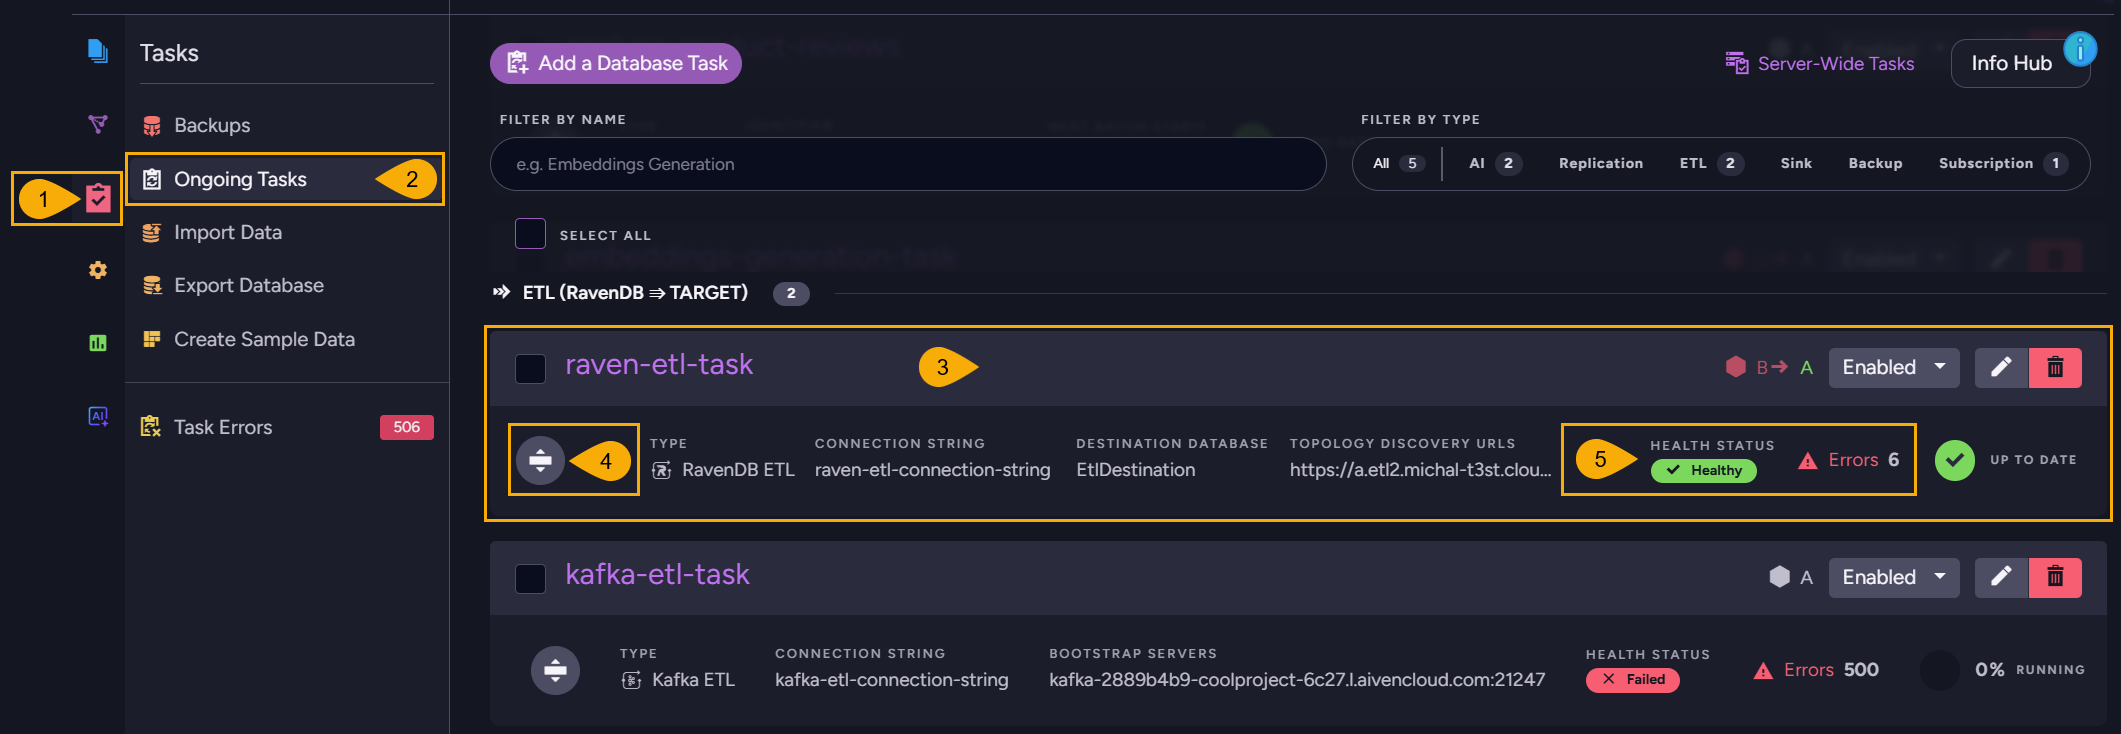
Task health on the Ongoing Tasks view
On the Ongoing Tasks view, each ETL or AI task bar displays the task's current health
state and the number of errors recorded for the task. Expanding the bar reveals these
details per node, along with the node's Connection status.
Collapsed view
-
Click to open the
Tasksmenu. -
Click to open the
Ongoing Tasksview. -
Task bar
-
Expand details
Click to expand the bar - see the per-node breakdown below. -
Task health and error count
Health Status- the task's current state (Healthy,Impaired, orFailed).Errors- the number of errors currently recorded for the task.
Expanded view
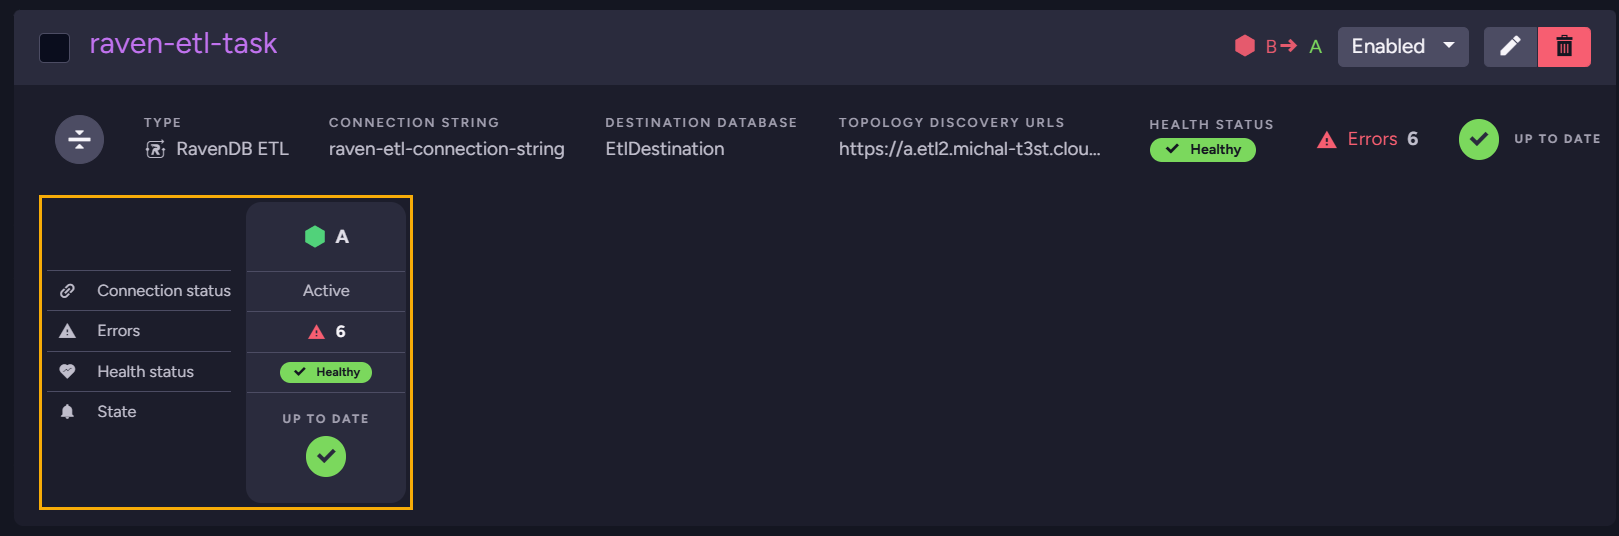
Each relevant node has its own column showing how the task is doing on that node. Only the node currently running the task, and any other nodes that recorded errors for it, are shown.
-
Connection status- the state of the node's connection to the task's destination. The value isActivewhile the connection is up, andReconnectafter a failure while the task waits to retry.
To retry the failing batch immediately, hoverReconnectand click the Retry now button that appears. -
Errors- the number of errors the task has raised on this node. -
Health status- the task's classification on this node (Healthy,Impaired, orFailed). -
State- the task's processing state on this node (such asUP TO DATEor0% RUNNING).
See the Ongoing Tasks - Overview page for a full walkthrough of the view, including filters, selection, and per-task actions.