Performance Views: Storage Reports
-
RavenDB provides two Storage Report views, each showing how disk space is used, broken down by component.
-
The database Storage Report (opened from
Stats) shows the storage of a single database.
The server-wide Storage Report (opened fromManage Server) shows the storage of the server-wide and cluster-level data RavenDB keeps outside any user database. -
In this article:
Database Storage Report
The database Storage Report shows the disk space a single database uses, broken down by component: the documents, each index, and the database configuration.
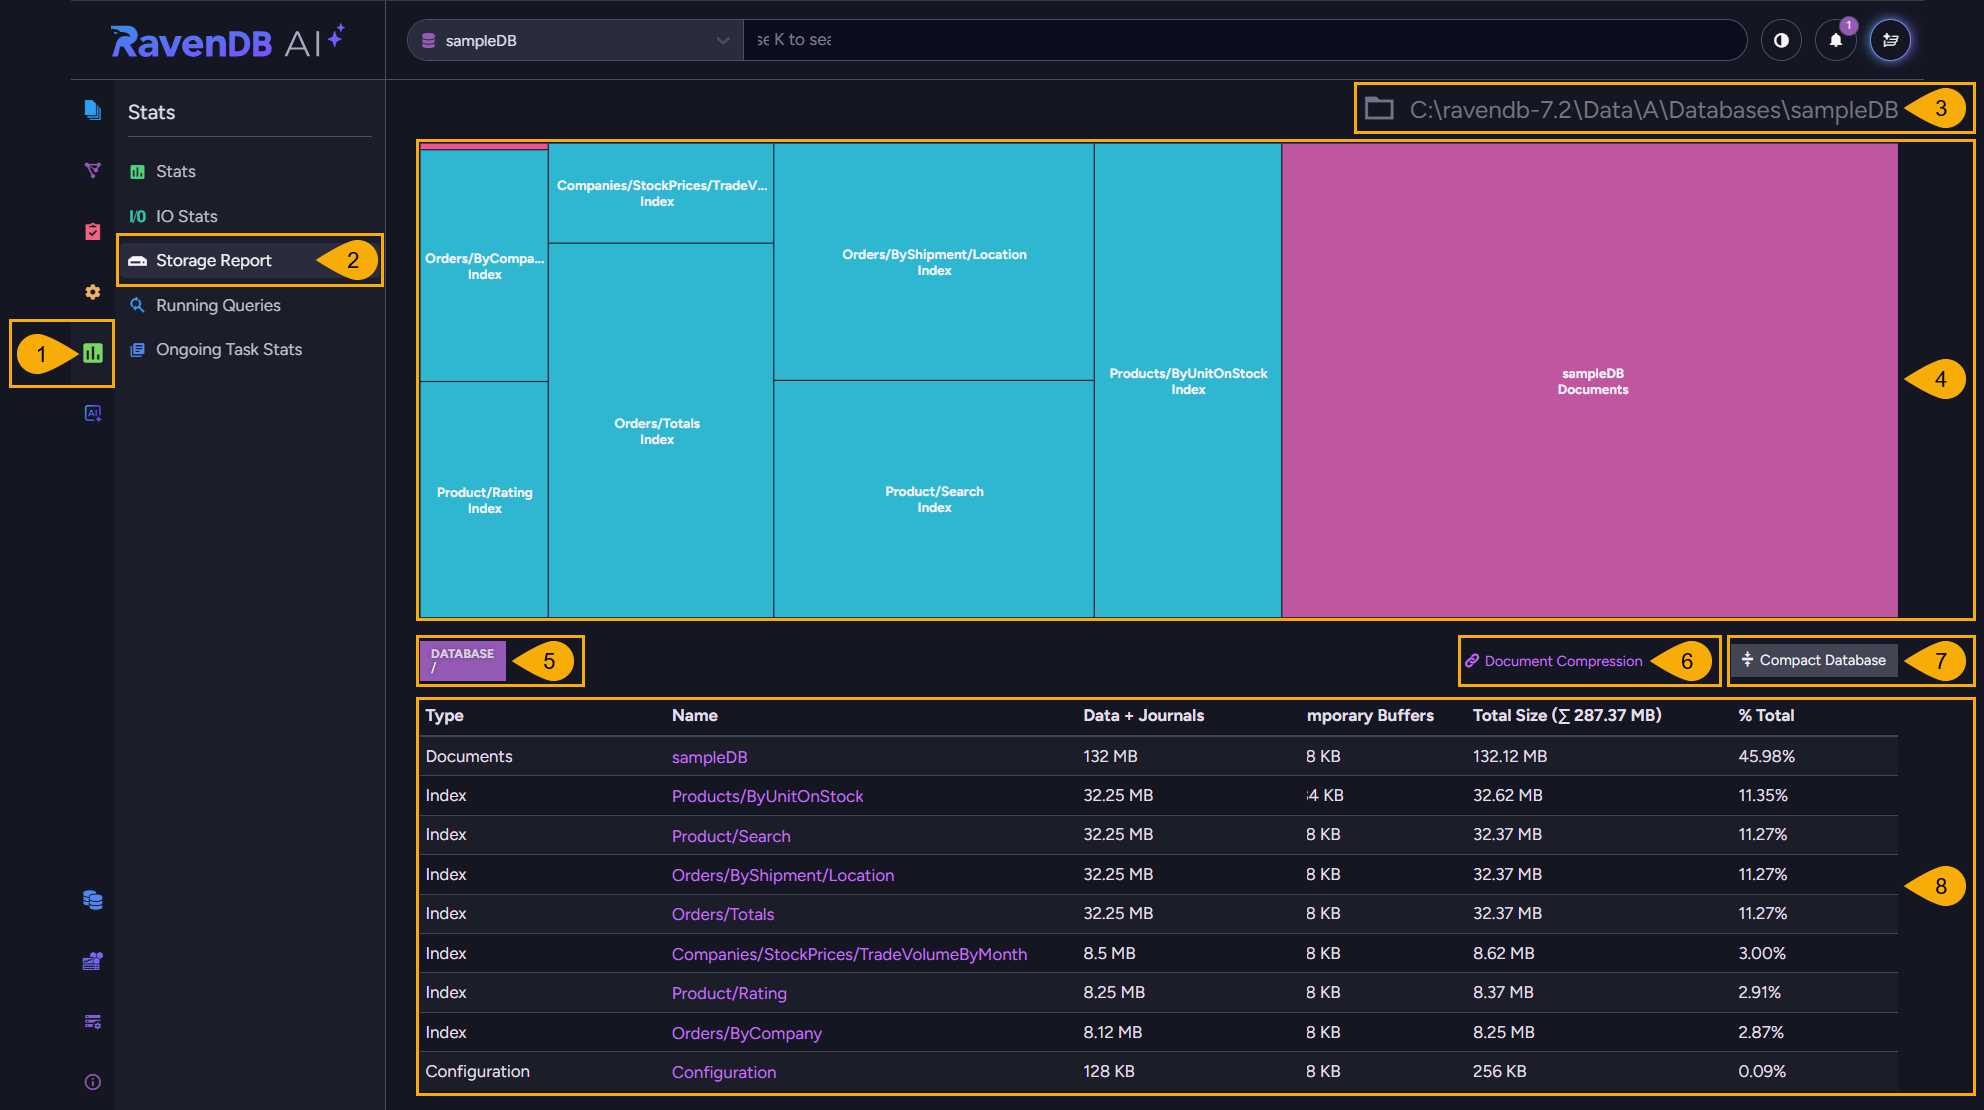
To open the database Storage Report: Stats > Storage Report
-
Stats
Open theStatsmenu. -
Storage Report
Open the Storage Report view. -
Database location on disk
The full path to the database's files on the current node. -
Storage map
Each rectangle represents a database component and is sized in proportion to the disk space the component occupies.
Hovering over a component shows its name and size, and, for some components, its type and entry count: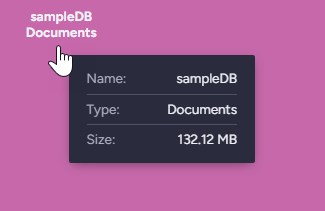
-
Breadcrumb
Selecting a component displays its position in the breadcrumb path and its details in the table below: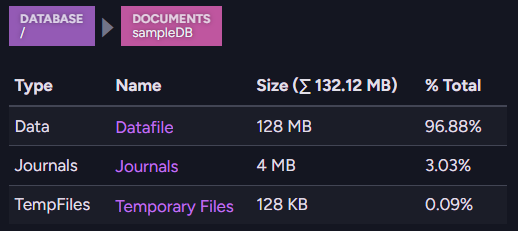
Click an earlier component in the breadcrumb path to return to it.
-
Document Compression
Open the documents compression settings for the database. -
Compact Database
Compact the database on the node you are currently connected to, reclaiming disk space left behind by deletes. You can compact documents, selected indexes, or both.
The database will be offline while the compaction runs.
You can also compact the database from the client API, using the compact database operation. -
Details table
Lists each component with its type, name, data and journal size, temporary buffer size, total size, and share of the database's total storage.
Server-wide Storage Report
The server-wide Storage Report shows the disk space RavenDB uses for the server-wide and cluster-level data it keeps outside any user database.
This storage is broken down into:
- the data file
- the journals
- the temporary files
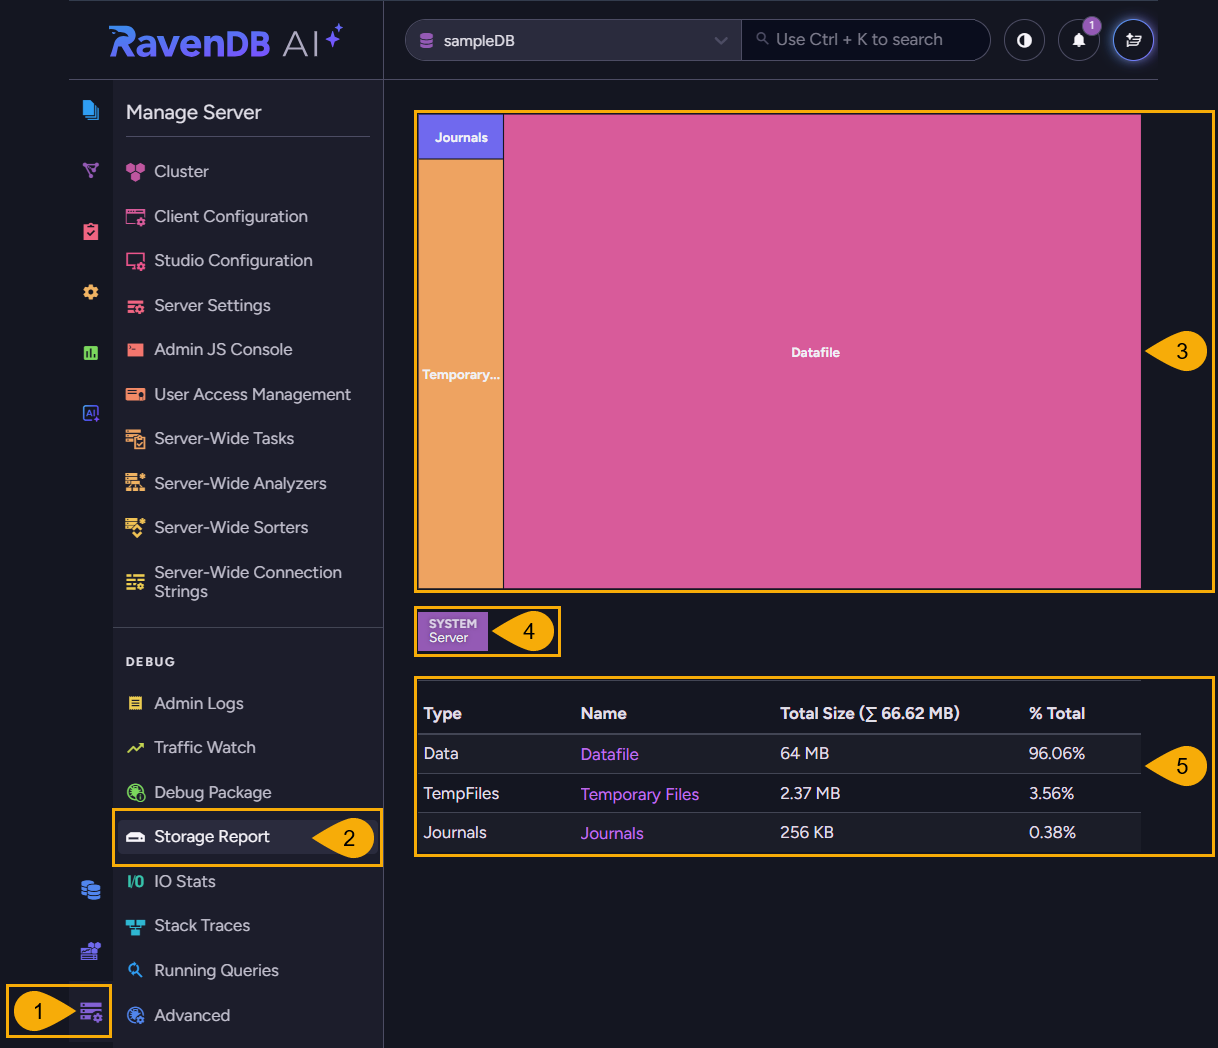
To open the server-wide Storage Report: Manage Server > Storage Report
-
Manage Server
Open theManage Servermenu. -
Storage Report
Open the Storage Report view, under theDebuggroup. -
Storage map
Each rectangle represents a component of the server-wide storage and is sized in proportion to the disk space the component occupies.
Hovering over a component shows its name and size, and, for some components, its type and entry count:
-
Breadcrumb
Selecting a component displays its position in the breadcrumb path and its details in the table below.In the example below, the data file is selected, revealing the data file's internal structures: tables, trees, free space, and pre-allocated buffers:
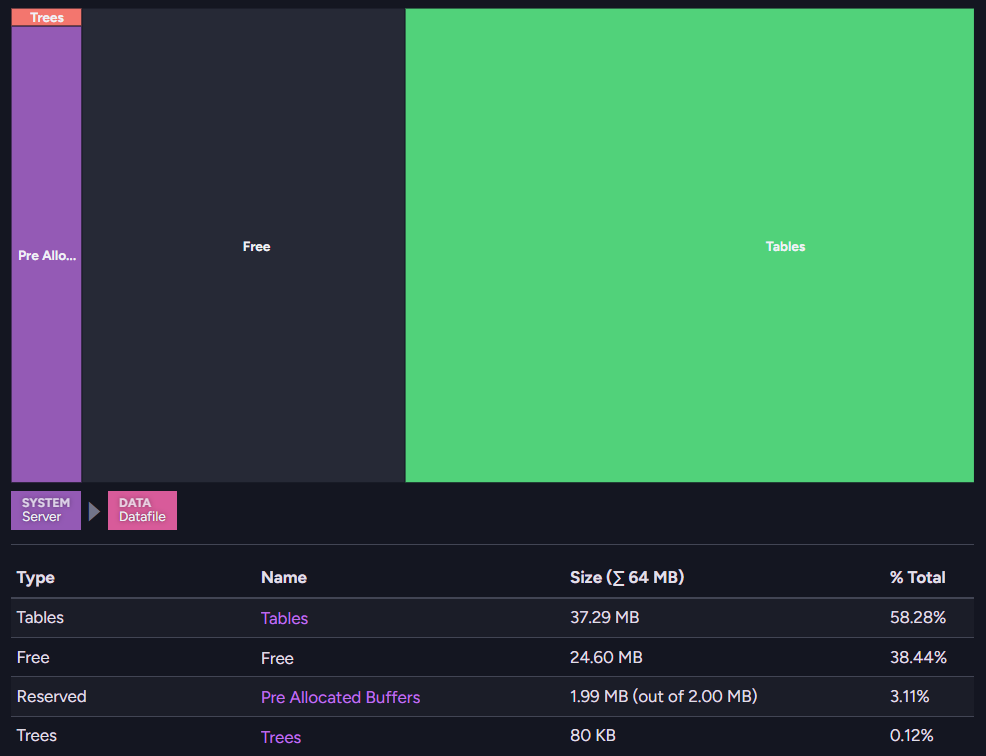
Click an earlier component in the breadcrumb path to return to it.
-
Details table
Lists each component with its type, name, total size, and its share of the total server-wide storage.