Performance Views: Ongoing Task Stats
-
Studio's Ongoing Task Stats view draws a graph of the work a database's ongoing tasks perform over time.
Use this view to follow tasks as they run. e.g., examine the duration of task operations, the volume of data each operation handles, and periods with no task activity. -
The graph shows a separate activity track for each monitored task (like an ETL task or a data subscription), and for each incoming and outgoing replication connection, including internal replication within the database group.
-
Each track is populated with operation bars, one per operation performed by the task.
-
Any user with read access to the database can open this view.
You can see the activity of the selected database's ongoing tasks, on the node that Studio is connected to.
On a sharded database, select a shard and one of the nodes hosting this shard before opening the view. -
RavenDB keeps each task's recent activity in memory, so the graph may already be populated when you open the view.
-
In this article:
The Ongoing Task Stats view
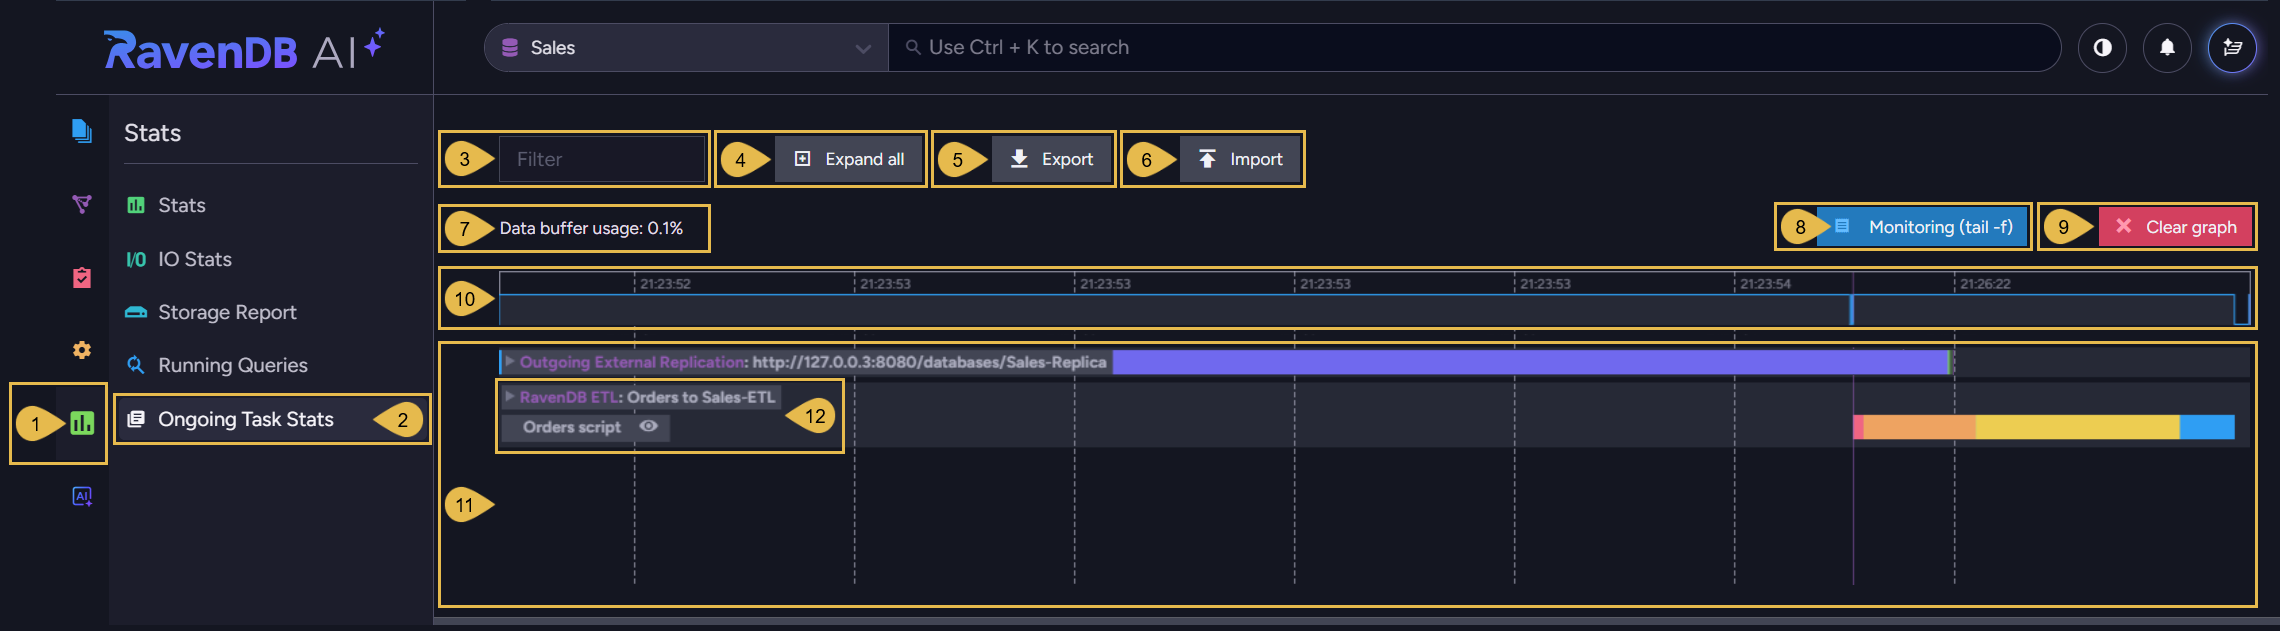
The Ongoing Task Stats view draws a separate activity track for each monitored task and each
replication connection, over a shared time axis.
Stats > Ongoing Task Stats
-
Stats
Open the Stats menu. -
Ongoing Task Stats
Open the Ongoing Task Stats view. -
Filter
Enter a string to show only the tracks whose names contain this string. -
Expand all
Expand every track to show the duration of the operations performed by each task. -
Export
Save the collected activity to a JSON file. -
Import
Load a file saved by Export and draw the exported activity in the graph.
The view stops recording while an imported file is displayed.
Close importreturns the view to the live graph. -
Data buffer usage
The share of the view's buffer in use.
When the buffer fills, recording stops and Studio asks you to clear the graph. -
Monitoring (tail -f)
Keep the graph scrolled to the newest data. -
Clear graph
Clear the graph and empty the Filter box.
Plotting resumes as new data arrives, with all tracks collapsed. -
Overview strip
The whole recorded period at a glance.
The line's height shows how many operations were running at each moment.
Drag the pointer across the strip to select a time range. -
The graph
The graph area, where activity tracks are drawn one under another over a single time axis, one track per monitored task or replication connection.
Operations are plotted on the tracks as bars, each bar positioned at its operation's start time, spanning the operation's duration.- A collapsed track shows a single row of operation bars.
- Expanding the track adds a row for each level of nested operations, so the steps that make up each operation become visible, and hovering over the bars can reveal additional details.
-
The track label
The label shows the task type followed by the track name.
Click the arrow at the label's left to expand or collapse the track.
A task's track is named after the task.
An outgoing replication connection's track is named with the URL of the destination database, and an incoming connection's track with the URL of the source database followed by the source database's ID.
Selecting a time range
To examine a specific activity period closely, stretch and slide a time range frame across the
overview strip. The graph will then plot only the selected range.
Rolling the mouse wheel over the graph zooms in or out as well, and turns off
Monitoring (tail -f).

-
Clear selection
Expand the selection to the entire recorded period. -
The selected range
The part of the recorded period the graph plots.
You can resize the selection frame by clicking and dragging its edges, or click within the selected area and slide the frame along the strip. -
Data outside the selection
Data recorded outside the selected range still appears in the strip, but is left out of the graph. -
The time axis
The time labels cover only the selected range.
Skipped idle periods
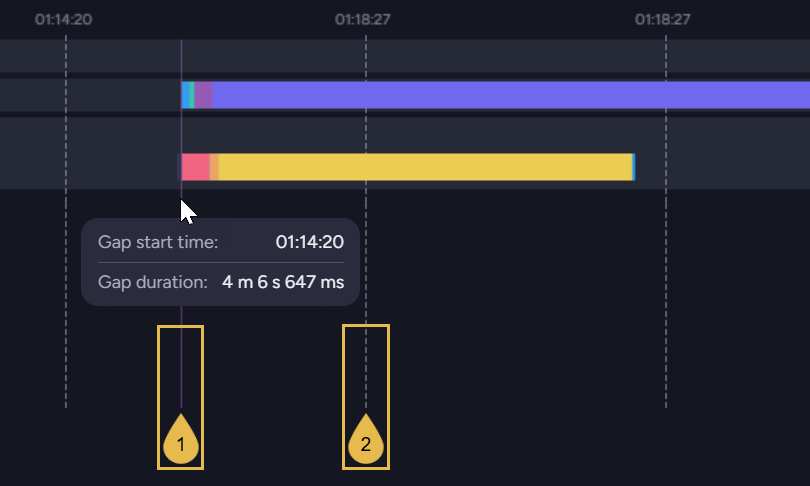
The time axis does not run at a constant rate: a period of more than ten seconds with no task
activity is skipped, so consecutive time labels can jump forward by minutes.
The labels are spaced at even distances along the axis, not at even time intervals, so zooming
into a short time range may display several labels sharing the same second.
-
Gap line
A solid purple line marks each skipped time period.
Hovering over the line shows the period's start time and duration. -
Grid line
A dashed line runs down from each time label. These lines mark the axis only, and carry no information about task activity.
Activity tracks
Expanding a track
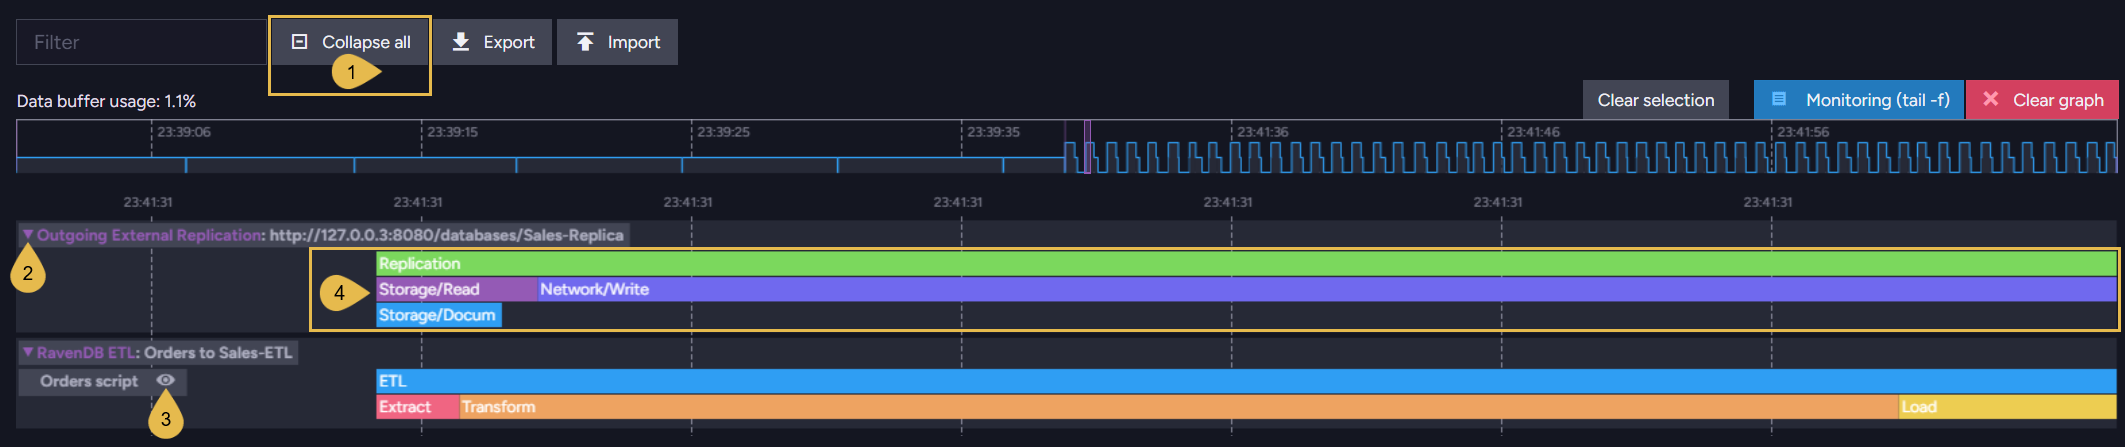
Click an activity track's label or one of its operation bars to expand or collapse the track.
-
Collapse all
Collapse all tracks. This button replaces Expand all once all tracks are expanded. -
Track arrow
The arrow indicates whether the track is expanded or collapsed. -
The eye icon
Opens the task's transformation script or query.
Learn below about the script or query preview. -
The track's operation bars
The framed track shows one batch replicated by an external replication task to the destination database.
The top bar represents the entire batch, and the lower bars represent operations performed by the task while handling this batch.
Operation bars
Hovering over an operation bar displays the properties recorded for the operation.
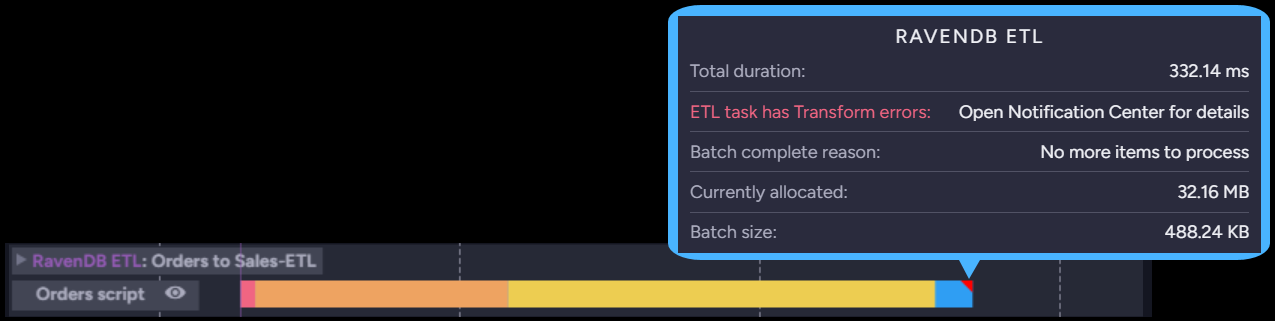
The images below show the popups of a RavenDB ETL track, in the scope of a single batch.
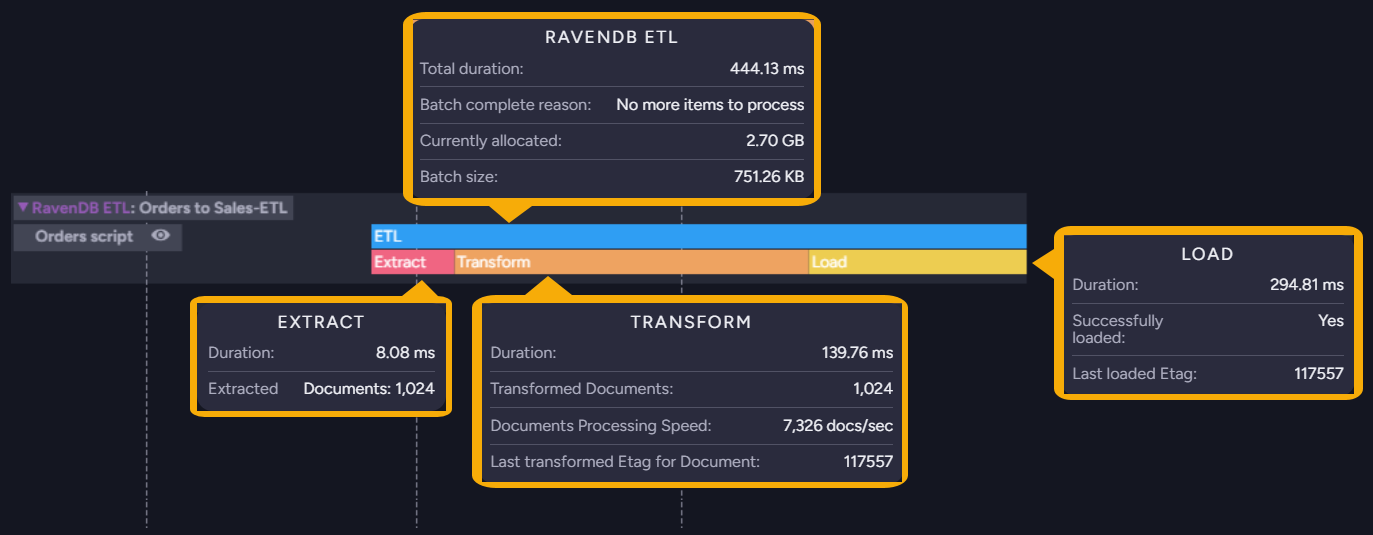
The popup for the top bar reports the properties of the batch as a whole: the total duration, the reason the batch ended, the memory the server allocated to the task, and the size of the data the batch carried.
The popup for a lower bar reports the duration of a single operation and the figures the operation produced, e.g., the number of items extracted or the speed at which the transformation script processed them.
The properties reported in the popups differ from one task type to another.
A dedicated article describes the properties reported for each task type,
e.g., RavenDB ETL Stats
or Subscription Stats.
A triangle marks an operation that ended with errors.
For an ETL task, the error popup names the failing stage (transform or load) and references the
notification center where additional details are available.
Operations in progress
Striped bars mark operations that are still running, animating the stripes while the operations
continue.
The bars turn solid once the operations complete.

Script or query preview
An ETL task's track lists each transformation script below the track label, and a data
subscription's track lists the subscription query.
Click the
eye icon
beside the script or query name to open a preview.
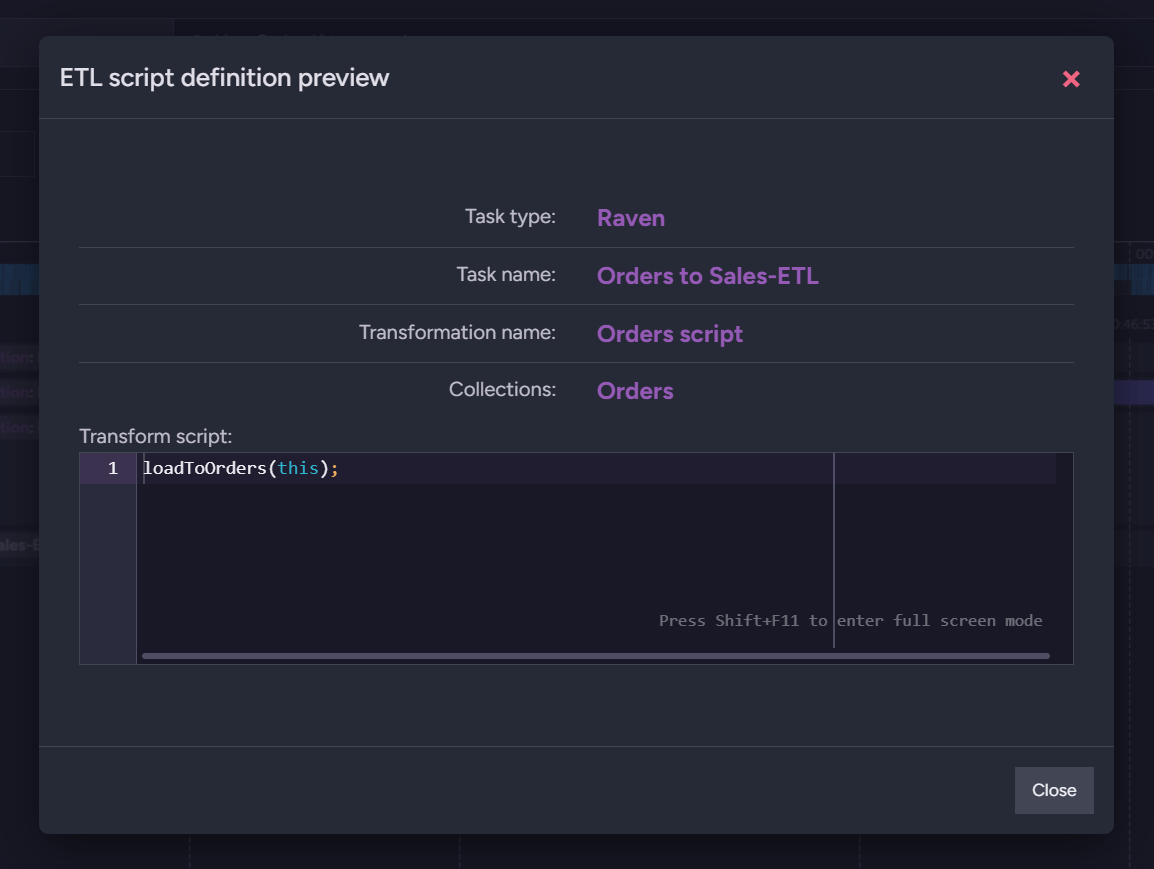
The preview names the task and the transformation script, lists the collections the script runs on, and shows the script itself.
What is monitored
Tasks
An activity track is drawn for each of the following ongoing tasks:
| Monitored task | Tracks |
|---|---|
| ETL tasks | One track per task, for every ETL type: RavenDB, SQL, Snowflake, OLAP, Elasticsearch, Kafka, RabbitMQ, Azure Queue Storage, and Amazon SQS. Embeddings generation and GenAI tasks are reported as ETL tasks as well. |
| Queue sinks | One track per task: Kafka, RabbitMQ, and Azure Service Bus. |
| CDC sinks | One track per task. |
| Data subscriptions | One track per subscription. |
| External replication tasks | One track per connection: Outgoing External Replication on the source database, and Incoming External Replication on the destination database. |
| Hub-sink replication tasks | One track per connection: Outgoing Pull Replication on the sending database, and Incoming Pull Replication on the receiving database. |
The following articles describe the figures reported for a specific task type:
External Replication Stats
Subscription Stats
RavenDB ETL Stats
SQL ETL Stats
OLAP ETL Stats
Internal replication
Replication within the database group is not an ongoing task, but the view draws an activity track
for each of its connections, incoming and outgoing, labeled Incoming Internal Replication and
Outgoing Internal Replication.
Monitoring backup tasks
Backup tasks, the only ongoing tasks absent from this view, can be monitored:
-
Via Studio
Backup tasks are listed atTasks>Backups, with the details of each task.
Running backup operations can be followed in the notification center, where they can also be delayed or aborted. -
Using the client API
To retrieve the status of a backup task after its last run, use GetPeriodicBackupStatusOperation. -
Using SNMP endpoints
Backup SNMP endpoints report the running backup operations, the number of enabled and active backup tasks, and the longest time any database has gone since its last backup.
The AI Task Stats view
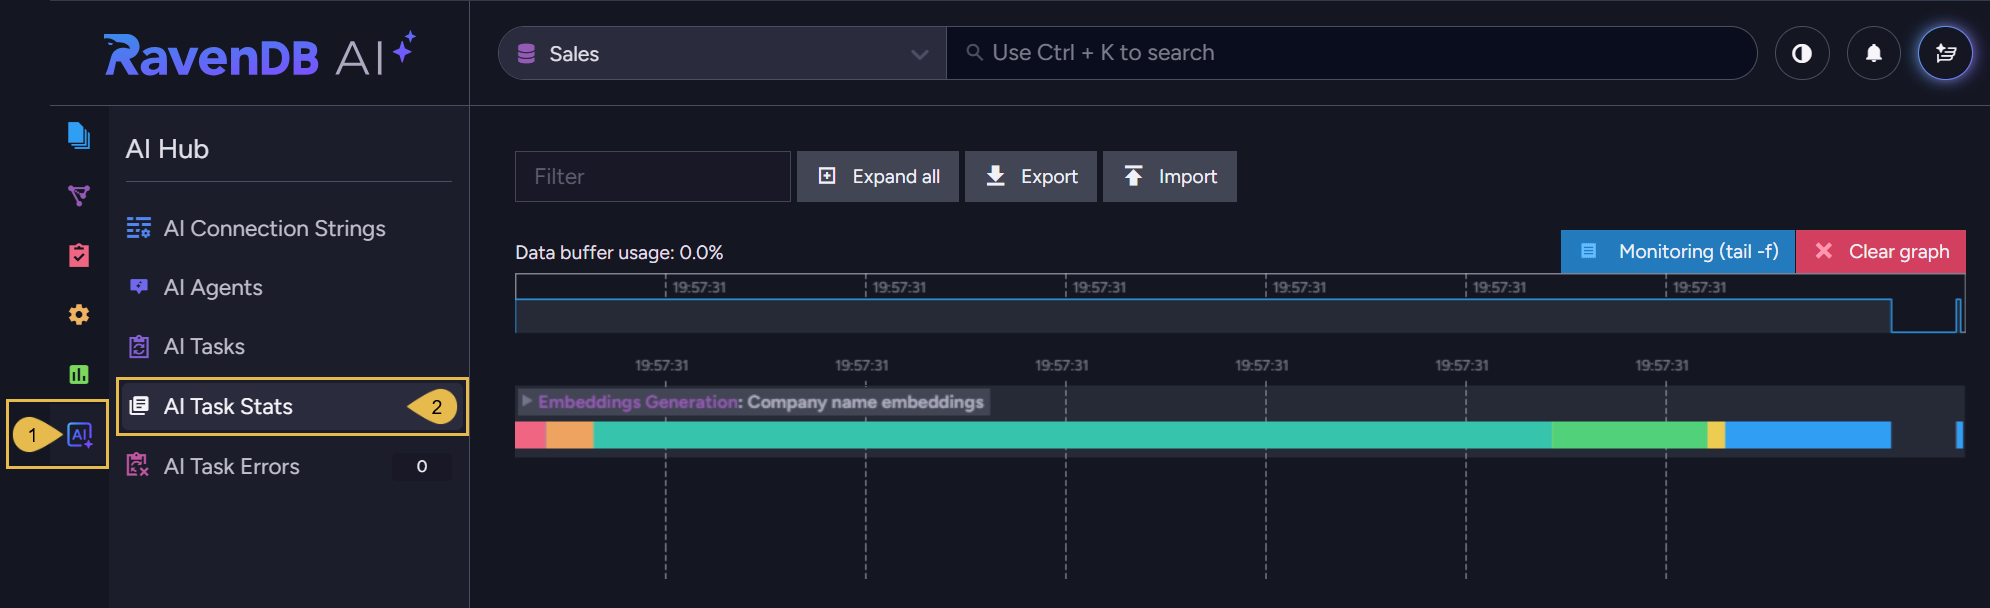
The AI Task Stats view, opened from the AI Hub menu, is similar in every way to the
Ongoing Task Stats view explained above, except for displaying only the activity of
two AI task types:
embeddings generation and GenAI.
AI Hub > AI Task Stats
-
AI Hub
Open the AI Hub menu. -
AI Task Stats
Open the AI Task Stats view.