Logging: Admin Logs View
-
Use Studio's Admin Logs view to follow the server's log as entries arrive, and to change the logging settings without restarting the server.
-
The logging settings in this view are server-wide.
They take effect immediately and apply to every open Studio session. -
For configuration options related to logging, see the Configuration options page.
To learn about RavenDB's logging system, see the Overview page. -
In this article:
The Admin Logs view
Studio's Admin Logs view shows the log entries the server generates, in real time.
Use this view to control log entries that reach the live stream as well as entries the server
writes to log files on disk.
Any user with an Operator or Cluster Admin
security clearance
can open this view.
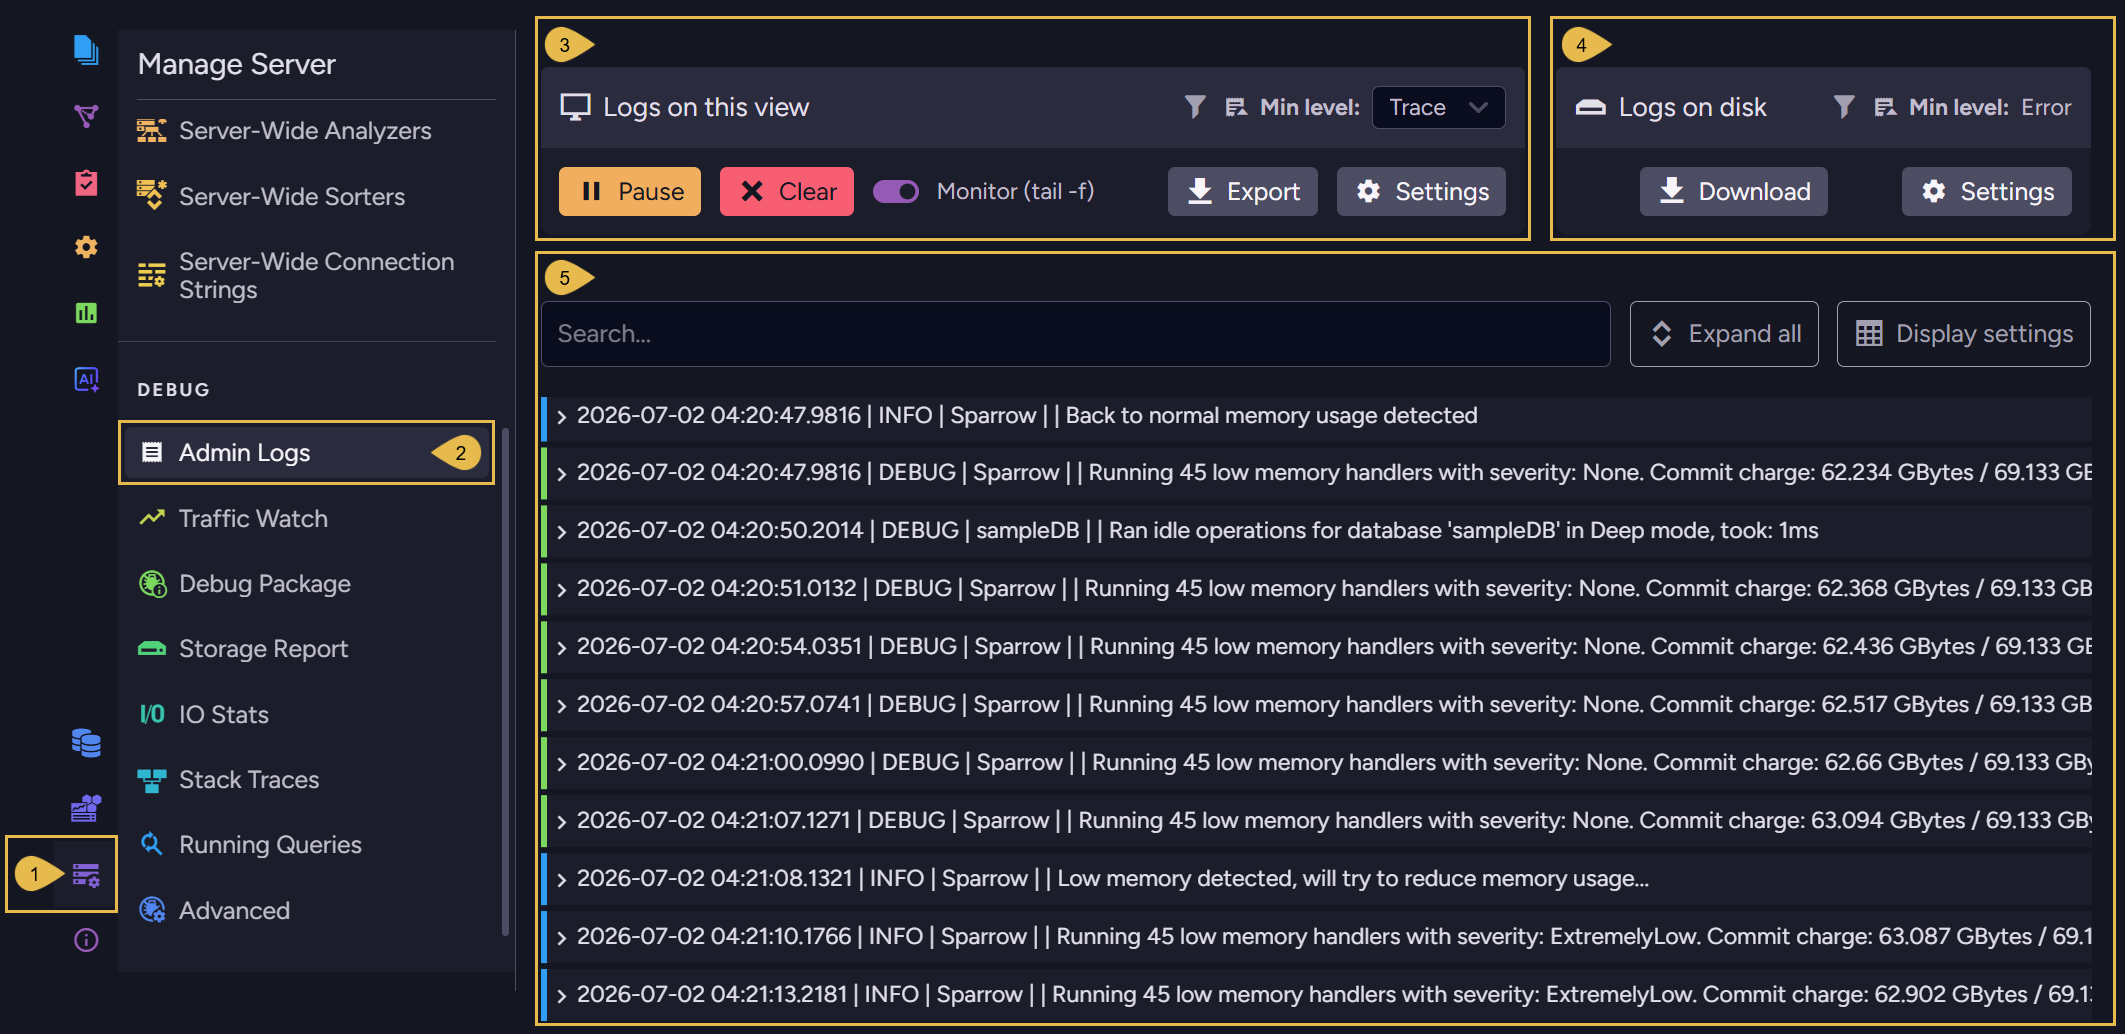
Manage Server > Admin Logs
-
Manage Server
Open the Manage Server menu. -
Admin Logs
Open the Admin Logs view. -
Logs on this view
Pause, clear, follow, or export the live stream, and control the entries the server streams to Studio. -
Logs on disk
Control the entries the server writes to the log files, and download those files by date range. -
The log stream
The live stream of log entries sent since you opened the view, with the newest entry last.
You can search the entries, expand them for their full details, and set the number of entries the view keeps.
Logs on this view
The settings in Logs on this view apply to the live stream only, and do not change the log
files on disk.
The server stores the logging level and filters you set, so every open Studio session will
show the same stream.

-
Active filters
Shows whether filters are currently applied to the live stream. -
Min level
Select the lowest logging level the server streams to Studio.
If you selectWarn, for example, the server streamsWarn,Error, andFatalentries, leaving outTrace,Debug, andInfo.
See the full scale in NLog-compliant logging levels.
The selected level takes effect immediately.
Log entries already on display whose level is lower than the selected level are removed from the stream. -
Pause, Clear, and Monitor (tail -f)
- Pause stops the stream. The server does not send entries to Studio while the stream
is paused, and the entries produced during the pause are lost.
ClickResumeto start a fresh stream. - Clear empties the display without interrupting the stream.
- Monitor (tail -f) keeps the newest entry in sight as entries arrive. Expanding an entry turns the option off, so the display stops scrolling.
- Pause stops the stream. The server does not send entries to Studio while the stream
is paused, and the entries produced during the pause are lost.
-
Export
Write the displayed entries to a JSON file. Each entry becomes one object, with the fields listed in The log stream.
The file is namedadmin-log-followed by the date and time.
e.g.,admin-log-2026-08-03 14-27.json
Only the entries currently on display are exported. -
Settings
Open the filter settings of the live stream.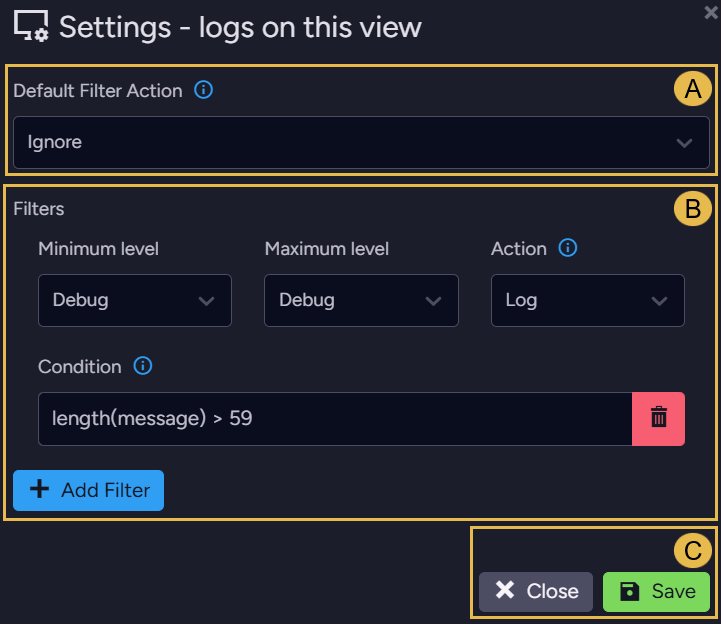
- A. Default Filter Action
The action taken on a log entry that matches no filter, or that matches only filters set toNeutral. The dropdown list stays disabled until at least one filter is defined. - B. Filters
Define new filters and edit existing ones.
See Filtering log entries for the fields of a filter and the order in which the server evaluates the filters. - C. Close and Save
Closeleaves the filters as they were,Saveapplies your changes.
Saved filters apply only to entries the server produces after you save, and leave the entries already on display as they are.
- A. Default Filter Action
Logs on disk
The settings in Logs on disk apply to the log files only, and do not change the live stream.
A new logging level or filter takes effect immediately, but the server reverts to the values
in its configuration when it restarts, unless you save the change to settings.json.
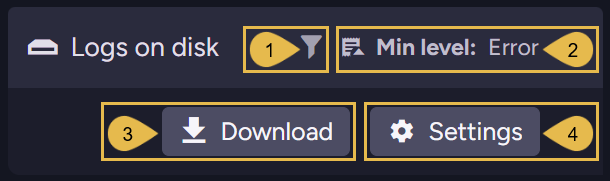
-
Active filters
Shows whether filters are currently applied to the log files. -
Min level
The minimum logging level currently applied to the log files.
The value is read-only. Change the level under Log settings. -
Download
Open the download dialog, where you can retrieve the server's log files by a date range you choose. -
Settings
Open Log settings to set the minimum logging level and the filters for the log files.
Use this dialog to modify the settings of the audit log, the Microsoft logs, Traffic Watch, and the event listener as well.
Downloading log files
Download collects the log files from the node that Studio is connected to and returns them
as a single zip archive, named after the time of the download and the node's tag.
To gather the logs of a whole cluster, repeat the download on each node.
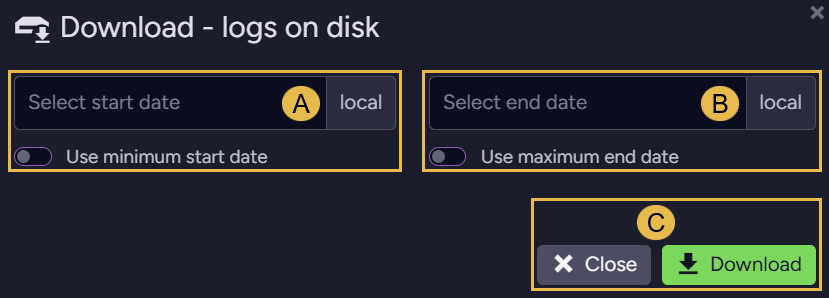
- A. Select start date
The start of the period the downloaded log files should cover, entered in the local time of the machine running the browser.
ToggleUse minimum start dateon to start from the earliest log file the server still keeps. - B. Select end date
The end of the period, also entered in local time, and later than the start date.
ToggleUse maximum end dateon to run to the most recent log file. - C. Close and Download
Closeleaves the dialog without downloading,Downloadbuilds the archive and sends it.
- The log file the server is currently writing is always included, whatever period you select.
- When no log file falls in the selected period, the archive holds a single text file naming the period and stating that no log file was found for it.
Log settings
The Settings dialog holds five groups of settings, one for each kind of output the server
can write to disk.
You can open one group at a time, and each group is saved on its own.
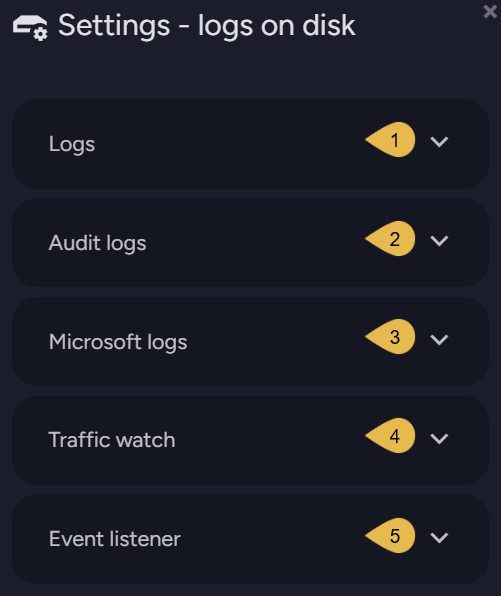
1. Logs
RavenDB's own log entries.
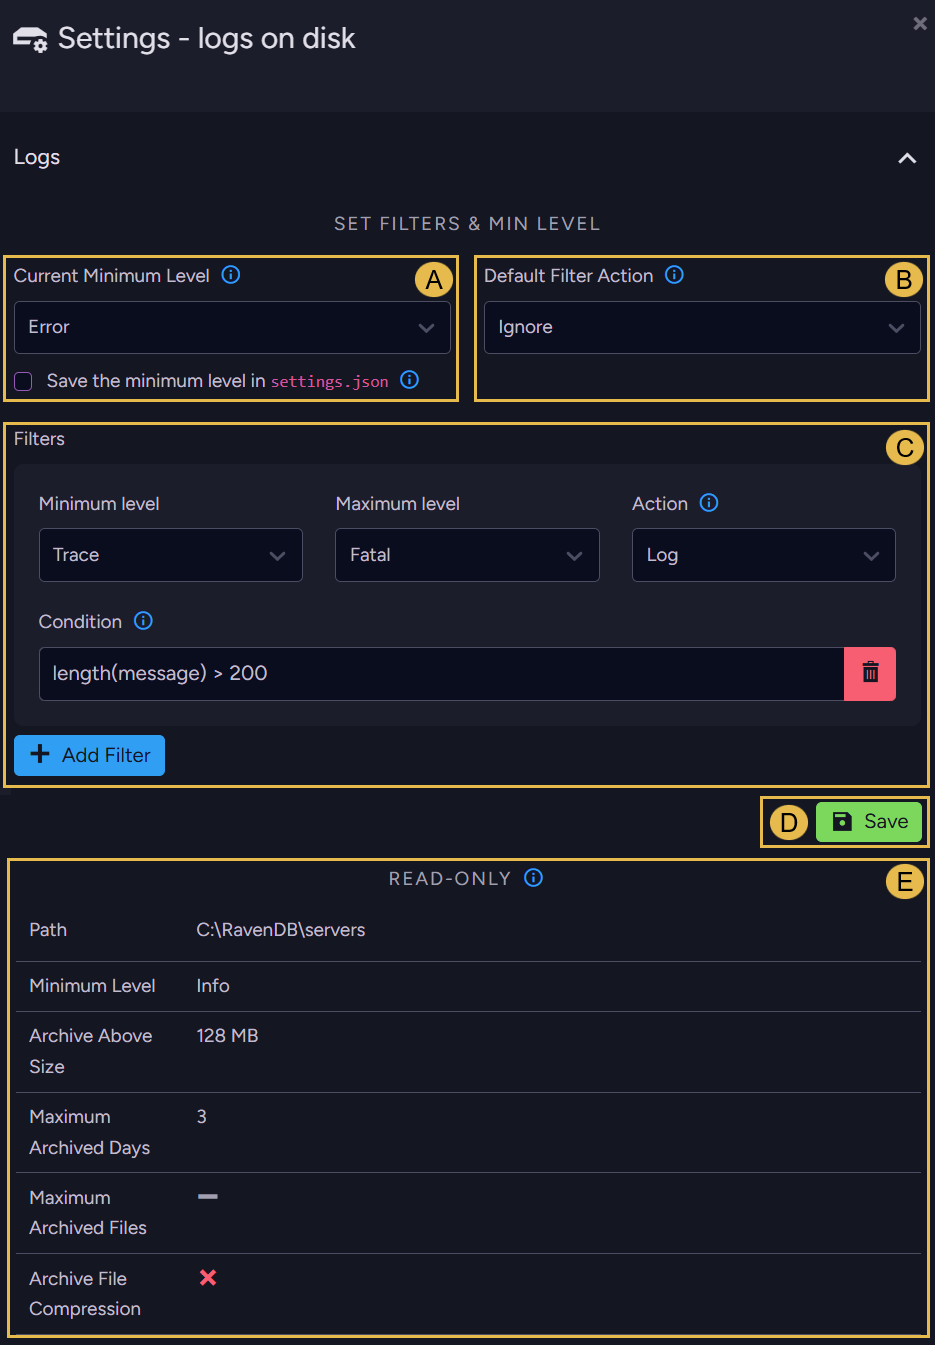
Set the minimum logging level and the filters that select the entries written to the log
files. The settings shown below them, like the log file path and the archiving thresholds,
come from logging configuration keys and cannot be changed in this dialog.
-
A. Current Minimum Level
Select the lowest logging level to write to the log files.- The level is applied before the filters, so a log entry whose level is lower than the minimum is discarded even when a filter would otherwise log it.
- A level you select takes effect immediately and holds until the server restarts.
CheckSave the minimum level in settings.jsonbefore saving to write the level into the configuration file, so it applies after a restart as well.
The checkbox does not appear on RavenDB Cloud, and the server refuses to write the level tosettings.jsonwhen the logging configuration comes from an NLog configuration file.
-
B. Default Filter Action
The action taken on a log entry that matches no filter, or that matches only filters set toNeutral. The action does not apply while no filter is defined. -
C. Filters
Define new filters and edit existing ones.
See Filtering log entries for the fields of a filter and the order in which the server evaluates the filters. -
D. Save
Apply the minimum level, the default action, and the filters to the server. -
E.
Read-only- the log file settings
The log file settings held in the server's configuration.
Each row links to the configuration key that sets it, where the setting is explained:Setting Configuration key Path Logs.Path Minimum Level Logs.MinLevel Archive Above Size Logs.ArchiveAboveSizeInMb Maximum Archived Days Logs.MaxArchiveDays Maximum Archived Files Logs.MaxArchiveFiles Archive File Compression Logs.EnableArchiveFileCompression A grey dash in the table means the setting has no value configured, a red cross means
false, and a green check meanstrue.
2. Audit logs
The server's audit log, kept in its
own set of files, separate from RavenDB's log files.
Audit logging is off until you configure a folder for the audit log files using the
Security.AuditLog.FolderPath
configuration key.
The Path row shows the configured folder.
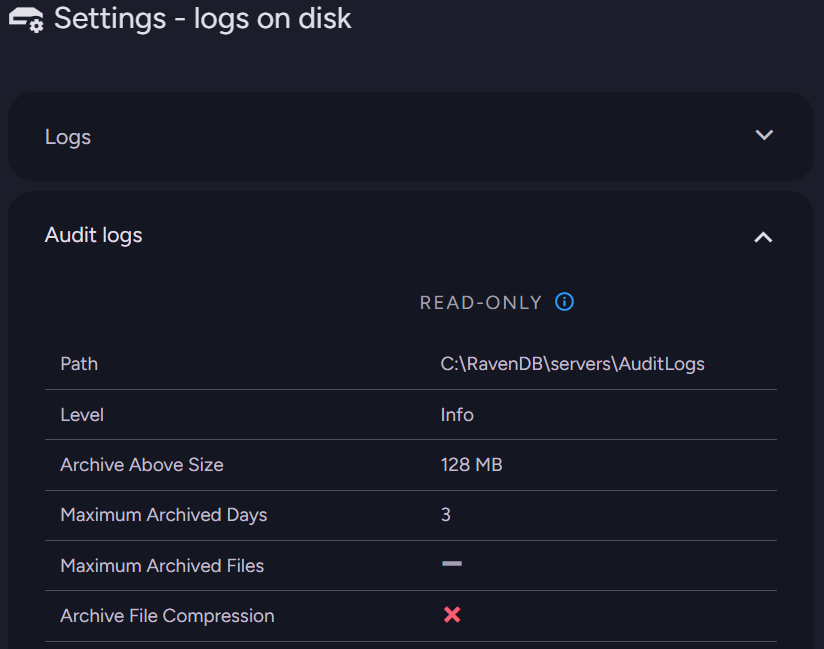
None of these settings can be modified in Studio.
Each row links to the configuration key that sets it, where the setting is explained:
| Setting | Configuration key |
|---|---|
| Path | Security.AuditLog.FolderPath |
| Level | None. Audit entries are written at Info. |
| Archive Above Size | Security.AuditLog.ArchiveAboveSizeInMb |
| Maximum Archived Days | Security.AuditLog.MaxArchiveDays |
| Maximum Archived Files | Security.AuditLog.MaxArchiveFiles |
| Archive File Compression | Security.AuditLog.EnableArchiveFileCompression |
Audit entries are written to the audit log files only, and do not appear in the live stream shown in this view or in RavenDB's own log files.
3. Microsoft logs
The Microsoft logs are diagnostic logs written by .NET and by
Kestrel, RavenDB's web server, covering events like connections and the start and finish of
each request.
These logs are disabled by default, and are enabled using the
Logs.Microsoft.Enabled configuration key.
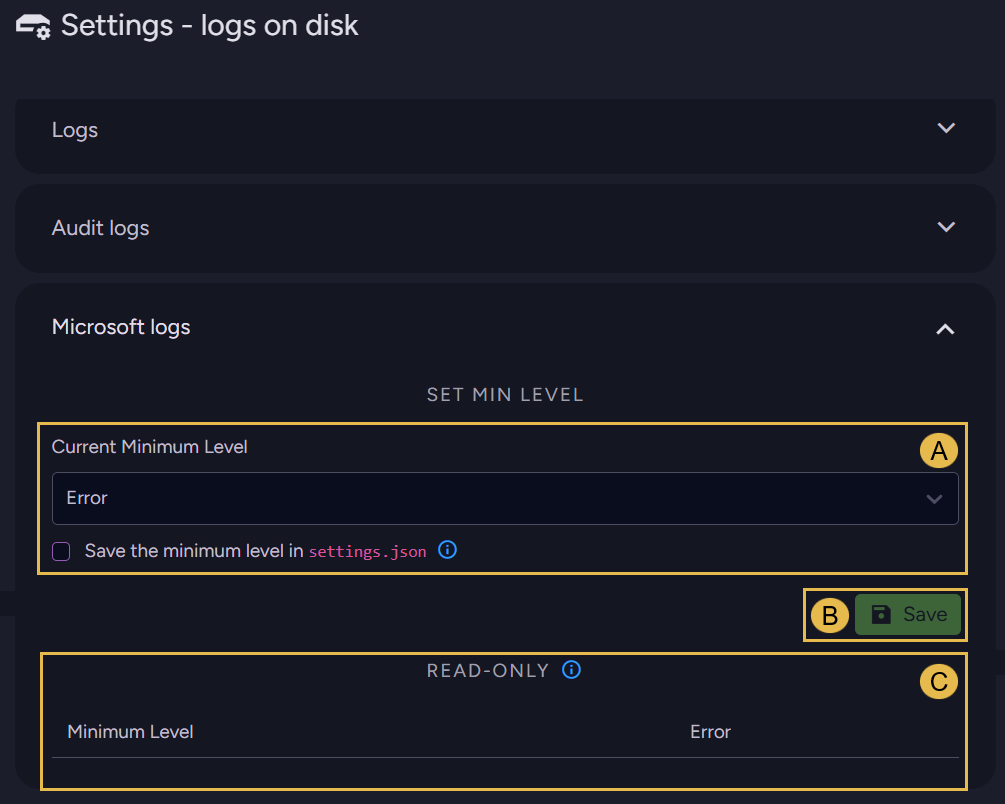
- A. Current Minimum Level
Select the lowest logging level of the Microsoft logs written to RavenDB's log files.
The level behaves like the one in Logs.
It takes effect immediately, and survives a restart only if you checkSave the minimum level in settings.jsonbefore saving. - B. Save
Apply the minimum level to the server.
While the Microsoft logs are disabled, the server rejects the change and names the configuration key that enables them. - C.
Read-only- the configured level
TheMinimum Levelrow shows the level set by the Logs.Microsoft.MinLevel configuration key.
4. Traffic watch
Traffic Watch monitors the requests a RavenDB server receives,
either as a live stream or by writing the requests to RavenDB's log files.
This group configures the writing to the log files, and leaves the live stream untouched.
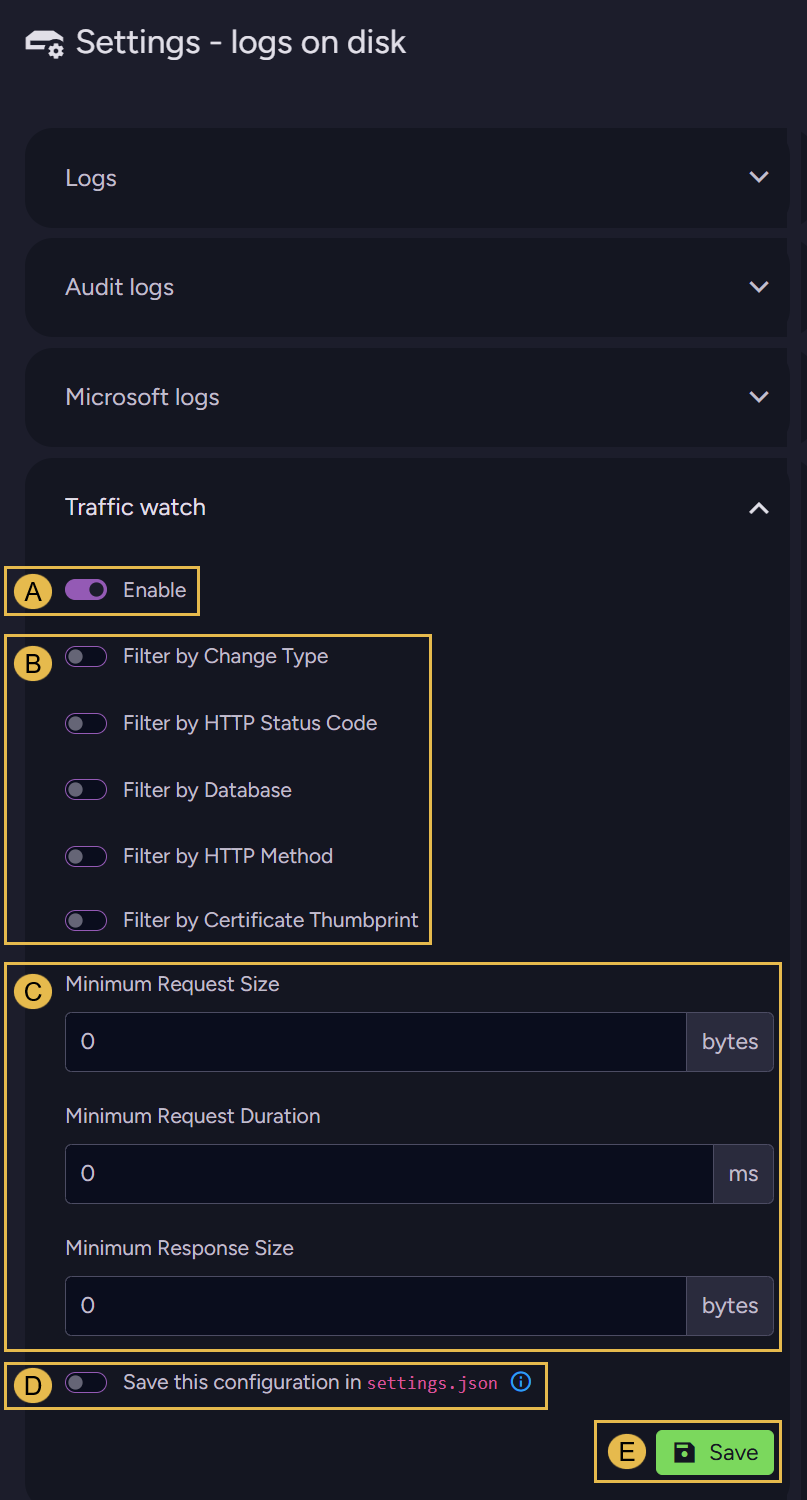
- A. Enable
Start writing the requests the server receives to the log files.
Toggling the option off stops the writing and keeps the filters and thresholds as they are. - B. The filter toggles
Toggle a filter on to narrow the requests written to the log files.
Each filter opens a list to select from.Select alltakes every option on the list.
Filter by Certificate Thumbprintappears only when Studio is connected over HTTPS.
See the Traffic Watch configuration options for a description of each filter. - C. Minimum Request Size, Minimum Request Duration, and Minimum Response Size
Write only the requests that reach the sizes and the duration you set. - D. Save this configuration in
settings.json
Write these settings intosettings.jsonso they apply after a restart as well.
The toggle does not appear on RavenDB Cloud. - E. Save
Apply the settings to the server.
5. Event listener
The event listener writes .NET runtime events into RavenDB's log files, covering garbage
collections, memory allocations, lock contention, and thread pool activity.
The listener is off by default. Once enabled, it records only the event types you select.
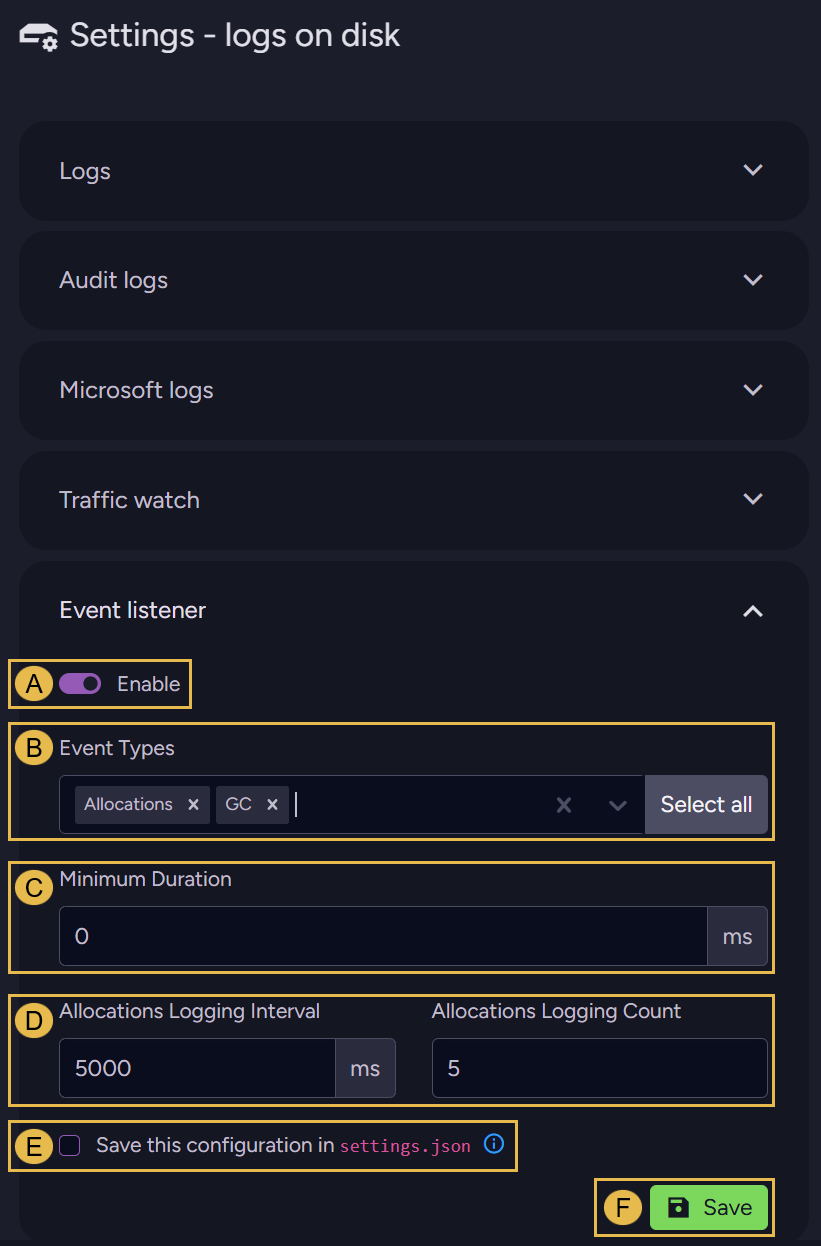
- A. Enable
Start writing runtime events to the log files.
Configuration key: Debug.EventListener.Mode - B. Event Types
Select the runtime events to record.
At least one type is required.Select alltakes every type on the list.
Configuration key: Debug.EventListener.EventTypes - C. Minimum Duration
Record only the events that last for at least the duration you set.
Configuration key: Debug.EventListener.MinimumDurationInMs - D. Allocations Logging Interval and Allocations Logging Count
Both apply to theAllocationsevent type.
Configuration keys: Debug.EventListener.AllocationsLoggingIntervalInMs and Debug.EventListener.AllocationsLoggingCount - E. Save this configuration in
settings.json
Write these settings intosettings.jsonso they apply after a restart as well.
The checkbox does not appear on RavenDB Cloud. - F. Save
Apply the settings to the server.
Filtering log entries
Use filters to select log entries more precisely than the minimum logging level allows, e.g.,
the entries of a single database, a single index, or a single logger.
Filters are defined the same way under
Logs on this view for the live stream, and under
Logs on disk for the log files.
The fields of a filter
A filter is made of four fields.
-
Minimum level and Maximum level
The range of logging levels the filter applies to.
A log entry whose level falls outside the range passes the filter untouched. -
Condition
An expression evaluated against the log entry. The filter applies only when the expression holds.
See Condition syntax. -
Action
The action taken on a log entry the filter applies to:Action Effect LogThe log entry is written. IgnoreThe log entry is not written. LogFinalThe log entry is written, and no further destination receives it. IgnoreFinalThe log entry is not written, and no further destination receives it. NeutralThe filter takes no decision. Evaluation moves on to the next filter, and if no filter decides, the default filter action applies.
The order of evaluation
The order of the filters
The minimum logging level is applied before the filters.
A log entry whose level is lower than the minimum is dropped, and the filters are never
consulted.
A log entry that passes the minimum level is checked against the filters in the order they are listed, from the top down.
- The first filter that applies and returns an action other than
Neutraldetermines the outcome, and the filters below it are not evaluated. - When every filter returns
Neutral, or no filter applies, the default filter action determines the outcome. - When no filters are defined at all, the default filter action has no effect and the log entry is written.
The order of the destinations
RavenDB hands each log entry to its destinations in a fixed order: first the log files, then
the live stream shown in this view.
The filters of a destination (e.g., the filters you set under
Logs on disk) are evaluated when the log entry reaches that
destination.
The LogFinal and IgnoreFinal actions stop a log entry at the destination whose filter
returned the action.
- When the action is returned by a log file filter, the log entry does not reach the live stream, and the live stream's filters are not evaluated.
- When the action is returned by a live stream filter, nothing further changes, because the live stream is the last destination.
When a condition cannot be evaluated
When a condition cannot be evaluated, because the expression is malformed for instance, the log entry is not written to the destination whose filter failed, and evaluation continues with the next destination.
Condition syntax
A condition is an expression written in NLog's condition language, which RavenDB evaluates against each log entry.
The parts of a log entry a condition can test include, among others:
| Reference | Part of the log entry |
|---|---|
level | The logging level. |
logger | The full class name of the logger that produced the log entry. |
message | The message text. |
exception | The exception attached to the log entry, or null when there is none. |
'${event-properties:item=Resource}' | The resource, e.g., the server or a database name. |
'${event-properties:item=Component}' | The component, e.g., an index name. |
'${event-properties:item=Data}' | The additional context, in JSON. |
References can be combined with and, or, and not.
Some examples:
| Condition | Applies to |
|---|---|
contains('${event-properties:item=Resource}', 'Accounting') | Log entries of the Accounting database. |
contains('${event-properties:item=Component}', 'Orders_ByCompany') | Log entries of the Orders_ByCompany index. |
logger == 'Voron.Impl.Journal.WriteAheadJournal' | Log entries from a single logger. |
exception != null | Log entries that carry an exception. |
length(message) > 200 | Log entries with a message longer than 200 characters. |
The log stream
The stream lists the log entries the server has sent since you opened the view, with the
newest entry last.
New entries arrive in batches, twice a second, and the view keeps them until you clear them or
leave the view.
The log entries
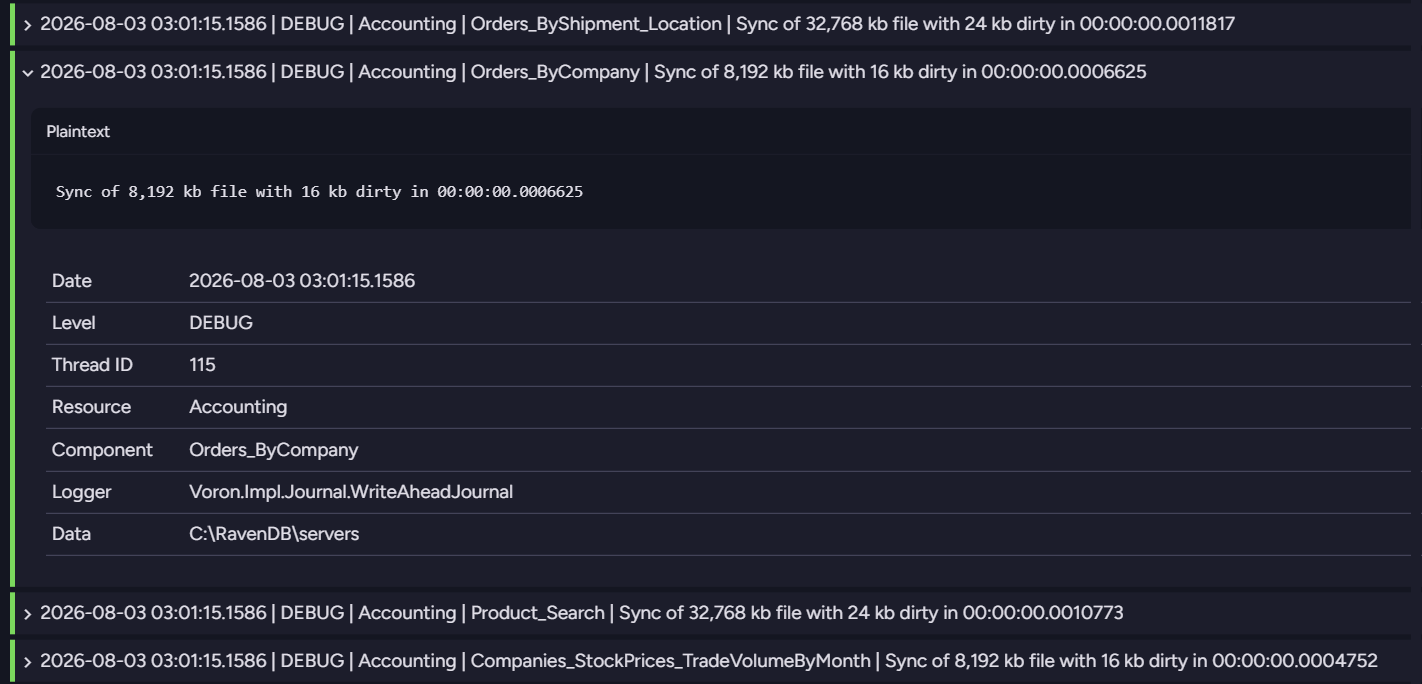
Each row is a single log entry, shown as Date | Level | Resource | Component | Message and
cut to the width of the view.
A colored bar on the left marks the level: grey for Trace, green for Debug, blue for
Info, yellow for Warn, orange for Error, and red for Fatal.
Click a row to expand it. The expanded row shows the full message, followed by the log entry's fields:
| Field | Description |
|---|---|
| Date | The time the log entry was written, in the server's local time. |
| Level | The logging level of the log entry. |
| Thread ID | The ID of the thread that produced the log entry. |
| Resource | The server or the database the log entry belongs to. |
| Component | The component within the resource, e.g., an index name. |
| Logger | The full class name of the logger that produced the log entry. |
| Data | Additional context, in JSON. |
A field with no value shows a dash.
The stream controls
-
Search
Show only the log entries that contain the text you type, in any of their fields. -
Expand all and Collapse all
Expand or collapse every log entry currently listed. -
Display settings
Set the maximum number of log entries the view keeps.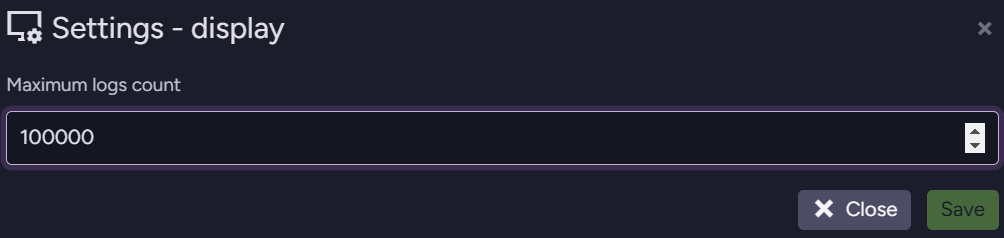
The default is 100,000, and the value can range from 1 to 200,000.
When the number of listed log entries reaches the maximum, Studio pauses the stream, and an alert appears, offering to clear the listed log entries or to raise the maximum number of entries.
Pausestays disabled until the number of listed log entries falls below the maximum.