Integrations: Prometheus
-
Prometheus is an open-source monitoring system.
A Prometheus server scrapes numeric metrics from HTTP endpoints that services expose, stores the values over time, and can graph them and raise alerts when a value crosses a threshold you have set. -
RavenDB exposes data metrics via an HTTP endpoint in a Prometheus-compatible format, allowing a Prometheus server to scrape the data from the endpoint and handle it.
-
A Prometheus endpoint is provided by RavenDB instances both on-premise and on the cloud.
-
To read metrics as JSON rather than in the Prometheus format, use the JSON monitoring endpoints.
-
In this article:
RavenDB Prometheus Endpoint
The path to the Prometheus endpoint of a RavenDB instance is: /admin/monitoring/v1/prometheus
To inspect the endpoint's output using a browser, add the endpoint path to the RavenDB server's URL.
e.g., http://live-test.ravendb.net/admin/monitoring/v1/prometheus
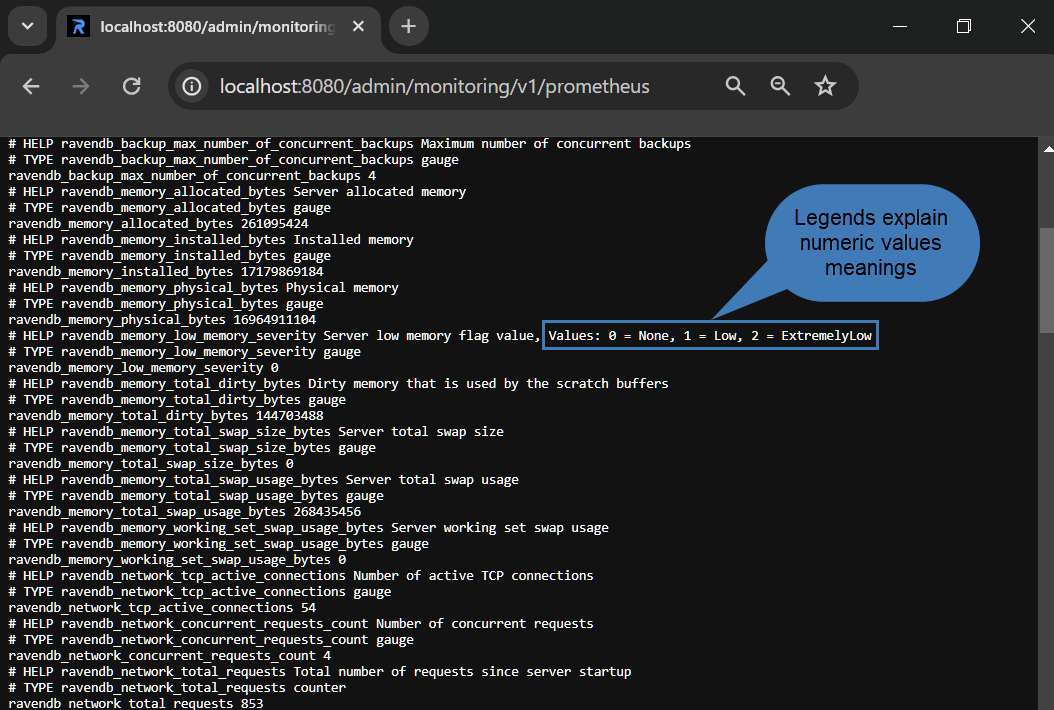
- As Prometheus handles only numeric values, the endpoint outputs all values as numbers,
providing legends that explain what the numbers mean.
Metrics values are also explained in the table below.
On a secure server, a request to the endpoint must present a client certificate with
Operator
clearance or higher.
On an unsecure server, no certificate is needed.
If the server's license does not include the Monitoring Endpoints
feature, requests to the endpoint fail with HTTP status 402 Payment Required.
Omit or Include Selected Metrics
Each skip* flag omits one metric group from the response when set to true; the
includeGcMetrics flag adds the GC metrics, the one group that is excluded by default.
All flags default to false.
| Flag | Metric group |
|---|---|
skipServerMetrics | Server metrics |
skipDatabasesMetrics | Database metrics |
skipIndexesMetrics | Index metrics |
skipCollectionsMetrics | Collection metrics |
skipEtlsMetrics | ETL task metrics |
skipAiTasksMetrics | AI task metrics |
skipCdcSinksMetrics | CDC Sink task metrics |
includeGcMetrics | GC metrics (excluded by default) |
e.g., to omit the index metrics:
http://localhost:8080/admin/monitoring/v1/prometheus?skipIndexesMetrics=true
To omit both the index and the server metrics:
http://localhost:8080/admin/monitoring/v1/prometheus?skipIndexesMetrics=true&skipServerMetrics=true
Metrics Provided by the Prometheus Endpoint
The following table lists the metrics that the /admin/monitoring/v1/prometheus endpoint provides.
In the endpoint's output, each name carries the ravendb_ prefix.
e.g., the server_uptime_seconds metric is exposed as ravendb_server_uptime_seconds.
The GC metrics appear only when the request sets the includeGcMetrics
flag, and each carries
a gckind label naming the kind of the garbage collection it describes.
| Metrics | Description |
|---|---|
| ai_task_documents_processed_per_second | Documents processed per second by the AI task (one minute rate) |
| ai_task_errors_count | Number of errors recorded for the AI task |
| ai_task_health_status | AI task health status + 0/1/2 0 => Healthy 1 => Impaired 2 => Failed |
| ai_task_last_successful_batch_time_in_seconds | Time since the AI task's last successful batch, in seconds |
| archived_data_processing_behavior | Archived data processing behavior + 0/1/2 0 => ExcludeArchived 1 => IncludeArchived 2 => ArchivedOnly |
| available_memory_for_processing_bytes | Available memory for processing |
| backup_current_number_of_running_backups | Number of currently running backups |
| backup_max_number_of_concurrent_backups | Maximum number of concurrent backups |
| cdc_sink_errors_count | Number of errors recorded for the CDC Sink task |
| cdc_sink_health_status | CDC Sink task health status + 0/1/2 0 => Healthy 1 => Impaired 2 => Failed |
| cdc_sink_last_successful_batch_time_in_seconds | Time since the CDC Sink task's last successful batch, in seconds |
| certificate_server_certificate_expiration_left_seconds | Server certificate expiration left in seconds |
| cluster_current_term | Cluster term |
| cluster_index | Cluster index |
| cluster_node_state | Current node state + 0/1/2 0 => Passive 1 => Candidate 2 => Follower 3 => LeaderElect 4 => Leader |
| collection_documents_count | Number of documents in collection |
| collection_documents_size_bytes | Size of documents |
| collection_revisions_size_bytes | Size of revisions |
| collection_tombstones_size_bytes | Size of tombstones |
| collection_total_size_bytes | Total size of collection |
| cpu_assigned_processor_count | Number of assigned processors on the machine |
| cpu_machine_io_wait | IO wait in % |
| cpu_machine_usage | Machine CPU usage in % |
| cpu_process_usage | Process CPU usage in % |
| cpu_processor_count | Number of processors on the machine |
| cpu_thread_pool_available_completion_port_threads | Number of available completion port threads in the thread pool |
| cpu_thread_pool_available_worker_threads | Number of available worker threads in the thread pool |
| database_ai_tasks_count | Number of AI tasks in the database |
| database_ai_tasks_errors_count | Total number of AI task errors in the database |
| database_ai_tasks_failed_count | Number of AI tasks with Failed health status in the database |
| database_ai_tasks_healthy_count | Number of AI tasks with Healthy health status in the database |
| database_ai_tasks_impaired_count | Number of AI tasks with Impaired health status in the database |
| database_alerts_count | Number of alerts |
| database_attachments_count | Number of attachments |
| database_cdc_sinks_count | Number of CDC Sink tasks in the database |
| database_cdc_sinks_errors_count | Total number of CDC Sink errors in the database |
| database_cdc_sinks_failed_count | Number of CDC Sink tasks with Failed health status in the database |
| database_cdc_sinks_healthy_count | Number of CDC Sink tasks with Healthy health status in the database |
| database_cdc_sinks_impaired_count | Number of CDC Sink tasks with Impaired health status in the database |
| database_documents_count | Number of documents |
| database_etls_count | Number of ETL tasks in the database |
| database_etls_errors_count | Total number of ETL errors in the database |
| database_etls_failed_count | Number of ETL tasks with Failed health status in the database |
| database_etls_healthy_count | Number of ETL tasks with Healthy health status in the database |
| database_etls_impaired_count | Number of ETL tasks with Impaired health status in the database |
| database_indexes_auto_count | Number of auto indexes |
| database_indexes_count | Number of indexes |
| database_indexes_errored_count | Number of error indexes |
| database_indexes_disabled_count | Number of disabled indexes |
| database_indexes_errors_count | Number of indexing errors |
| database_indexes_idle_count | Number of idle indexes |
| database_indexes_stale_count | Number of stale indexes |
| database_indexes_static_count | Number of static indexes |
| database_performance_hints_count | Number of performance hints |
| database_rehabs_count | Number of rehabs |
| database_replication_factor | Database replication factor |
| database_revisions_count | Number of revision documents |
| database_statistics_doc_puts_per_second | Number of document puts per second (one minute rate) |
| database_statistics_map_index_indexes_per_second | Number of indexed documents per second for map indexes (one minute rate) |
| database_statistics_map_reduce_index_mapped_per_second | Number of maps per second for map-reduce indexes (one minute rate) |
| database_statistics_map_reduce_index_reduced_per_second | Number of reduces per second for map-reduce indexes (one minute rate) |
| database_statistics_request_average_duration_seconds | Average request time in seconds |
| database_statistics_requests_count | Number of requests from database start |
| database_statistics_requests_per_second | Number of requests per second (one minute rate) |
| database_storage_documents_allocated_data_file_bytes | Documents storage allocated size |
| database_storage_documents_used_data_file_bytes | Documents storage used size |
| database_storage_indexes_allocated_data_file_bytes | Index storage allocated size |
| database_storage_indexes_used_data_file_bytes | Index storage used size |
| database_storage_io_read_operations | Disk IO Read operations |
| database_storage_io_write_operations | Disk IO Write operations |
| database_storage_queue_length | Disk Queue length |
| database_storage_read_throughput_bytes | Disk Read Throughput |
| database_storage_total_allocated_storage_file_bytes | Total storage size |
| database_storage_total_free_space_bytes | Remaining storage disk space |
| database_storage_write_throughput_bytes | Disk Write Throughput |
| database_time_since_last_backup_seconds | Last backup |
| database_unique_attachments_count | Number of unique attachments |
| database_uptime_seconds | Database up-time |
| databases_loaded_count | Number of loaded databases |
| databases_total_count | Number of all databases |
| etl_documents_processed_per_second | Documents processed per second by the ETL task (one minute rate) |
| etl_errors_count | Number of errors recorded for the ETL task |
| etl_health_status | ETL task health status + 0/1/2 0 => Healthy 1 => Impaired 2 => Failed |
| etl_last_successful_batch_time_in_seconds | Time since the ETL task's last successful batch, in seconds |
| gc_compacted | Indicates if the last garbage collection was compacting (1 = yes, 0 = no) |
| gc_concurrent | Indicates if the last garbage collection was concurrent (1 = yes, 0 = no) |
| gc_finalization_pending_count | Number of objects pending finalization observed during the last garbage collection |
| gc_fragmented_mb | Heap fragmentation in MB after the last garbage collection |
| gc_generation | Generation collected by the last garbage collection |
| gc_heap_size_mb | Total GC heap size in MB after the last garbage collection |
| gc_high_memory_load_threshold_mb | High memory load threshold in MB at the time of the last garbage collection |
| gc_index | Index of the last garbage collection |
| gc_memory_load_mb | Memory load in MB at the time of the last garbage collection |
| gc_pause_durations_1_seconds | First GC pause duration in seconds recorded during the last garbage collection |
| gc_pause_durations_2_seconds | Second GC pause duration in seconds recorded during the last garbage collection |
| gc_pause_time_percentage | Percentage of time spent paused for GC since the previous collection |
| gc_pinned_objects_count | Number of pinned objects observed during the last garbage collection |
| gc_promoted_mb | Memory promoted during the last garbage collection in MB |
| gc_total_available_memory_mb | Total available memory for the GC in MB at the time of the last garbage collection |
| gc_total_committed_mb | Total committed managed heap size in MB after the last garbage collection |
| index_entries_count | Number of entries in the index |
| index_errors | Number of index errors |
| index_is_invalid | Indicates if index is invalid |
| index_lock_mode | Index lock mode + 0/1/2 0 => Unlock 1 => LockedIgnore 2 => LockedError |
| index_mapped_per_second | Number of maps per second (one minute rate) |
| index_priority | Index priority + 0/1/2 0 => Low 1 => Normal 2 => High |
| index_reduced_per_second | Number of reduces per second (one minute rate) |
| index_state | Index state + 0/1/2/3 0 => Normal 1 => Disabled 2 => Idle 3 => Error |
| index_status | Index status + 0/1/2/3 0 => Running 1 => Paused 2 => Disabled 3 => Pending (for rolling indexes) |
| index_time_since_last_indexing_seconds | Time since last indexing |
| index_time_since_last_query_seconds | Time since last query |
| index_type | Index type + 0/1/2/3/4/5/6/7 0 => None 1 => AutoMap 2 => AutoMapReduce 3 => Map 4 => MapReduce 5 => Faulty 6 => JavaScriptMap 7 => JavaScriptMapReduce |
| license_expiration_left_seconds | Server license expiration left |
| license_max_cores | Server license max CPU cores |
| license_type | Server license type + -1/0/1/2/3/4/5/6/7 -1 => Invalid 0 => None 1 => Community 2 => Reserved 3 => Professional 4 => Enterprise 5 => Developer 6 => Essential 7 => EnterpriseAi |
| license_utilized_cpu_cores | Server license utilized CPU cores |
| managed_memory_bytes | Server managed memory size |
| memory_allocated_bytes | Server allocated memory |
| memory_installed_bytes | Installed memory |
| memory_low_memory_severity | Server low memory flag value + 0/1/2 0 => None 1 => Low 2 => ExtremelyLow |
| memory_physical_bytes | Physical memory |
| memory_total_dirty_bytes | Dirty memory that is used by the scratch buffers |
| memory_total_swap_size_bytes | Server total swap size |
| memory_total_swap_usage_bytes | Server total swap usage |
| memory_working_set_swap_usage_bytes | Server working set swap usage |
| network_concurrent_requests_count | Number of concurrent requests |
| network_last_authorized_non_cluster_admin_request_time_in_sec | Server last authorized non cluster admin request time |
| network_last_request_time_in_seconds | Server last request time |
| network_requests_per_second | Number of requests per second (one minute rate) |
| network_tcp_active_connections | Number of active TCP connections |
| network_total_requests | Total number of requests since server startup |
| server_ai_tasks_count | Total number of AI tasks across all databases |
| server_ai_tasks_errors_count | Total number of AI task errors across all databases |
| server_ai_tasks_failed_count | Number of AI tasks with Failed health status across all databases |
| server_ai_tasks_healthy_count | Number of AI tasks with Healthy health status across all databases |
| server_ai_tasks_impaired_count | Number of AI tasks with Impaired health status across all databases |
| server_cdc_sinks_count | Total number of CDC Sink tasks across all databases |
| server_cdc_sinks_errors_count | Total number of CDC Sink errors across all databases |
| server_cdc_sinks_failed_count | Number of CDC Sink tasks with Failed health status across all databases |
| server_cdc_sinks_healthy_count | Number of CDC Sink tasks with Healthy health status across all databases |
| server_cdc_sinks_impaired_count | Number of CDC Sink tasks with Impaired health status across all databases |
| server_disk_remaining_storage_space_percentage | Remaining server storage disk space in % |
| server_disk_system_store_total_data_file_size_bytes | Server storage total size |
| server_disk_system_store_used_data_file_size_bytes | Server storage used size |
| server_etls_count | Total number of ETL tasks across all databases |
| server_etls_errors_count | Total number of ETL errors across all databases |
| server_etls_failed_count | Number of ETL tasks with Failed health status across all databases |
| server_etls_healthy_count | Number of ETL tasks with Healthy health status across all databases |
| server_etls_impaired_count | Number of ETL tasks with Impaired health status across all databases |
| server_info | Server Info |
| server_process_id | Server process ID |
| server_storage_io_read_operations | Disk IO Read operations |
| server_storage_io_write_operations | Disk IO Write operations |
| server_storage_queue_length | Disk Queue length |
| server_storage_read_throughput_bytes | Disk Read Throughput |
| server_storage_total_free_space_bytes | Remaining storage disk space |
| server_storage_write_throughput_bytes | Disk Write Throughput |
| server_uptime_seconds | Server up-time |
| unmanaged_memory_bytes | Server unmanaged memory size |
Using the RavenDB Endpoint by a Prometheus Server
Configuring and running Prometheus
To direct a Prometheus server to the Prometheus endpoint of a RavenDB instance, add a
scrape job
for the RavenDB server under the scrape_configs section of the prometheus.yml configuration file.
The following sample defines two scrape jobs: one for a local unsecure server, and one for
three secure nodes of a cloud cluster.
scrape_configs:
  - job_name: "local-raven-instance"
    # Monitor a local, unsecure RavenDB server
    metrics_path: "/admin/monitoring/v1/prometheus"
    static_configs:
      - targets:
          - "localhost:8080"

  - job_name: "cloud-raven-instance"
    # Monitor 3 RavenDB nodes on the cloud
    scheme: https
    tls_config:
      cert_file: "a.client.certificate.crt"
      key_file: "a.client.certificate.key"
    metrics_path: "/admin/monitoring/v1/prometheus"
    static_configs:
      - targets:
          - "a.cloudtest.ravendb.org"
          - "b.cloudtest.ravendb.org"
          - "c.cloudtest.ravendb.org"
To load the scrape jobs, run the Prometheus server and point it at your prometheus.yml file:
./prometheus --config.file=prometheus.yml
Browsing the metrics in Prometheus
Once the Prometheus server is running, you can browse and graph the RavenDB metrics it collects.
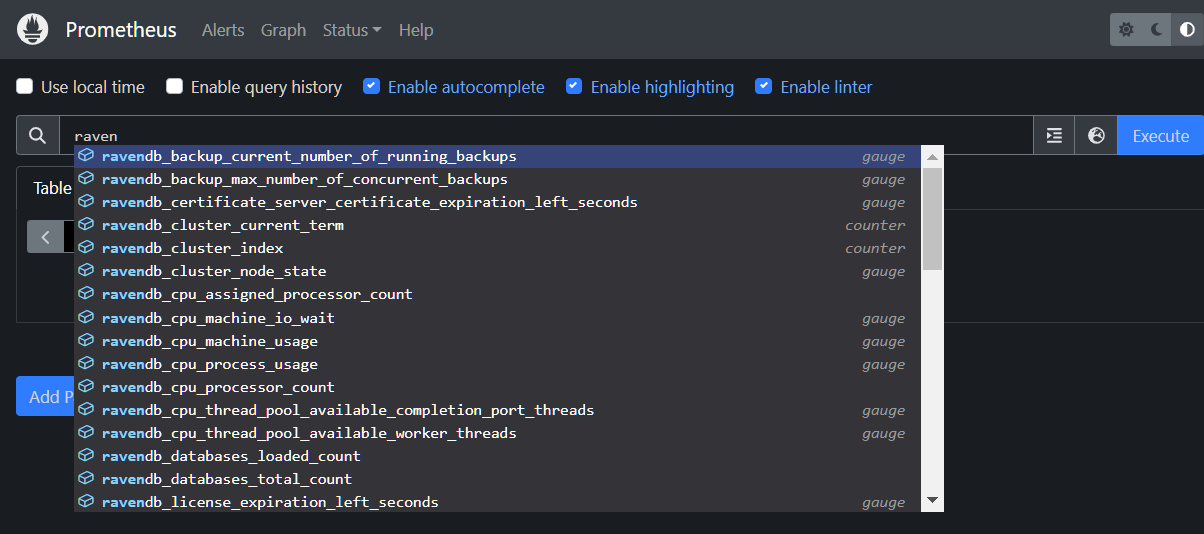
Typing raven in the search bar lists the metrics the RavenDB endpoint provides:
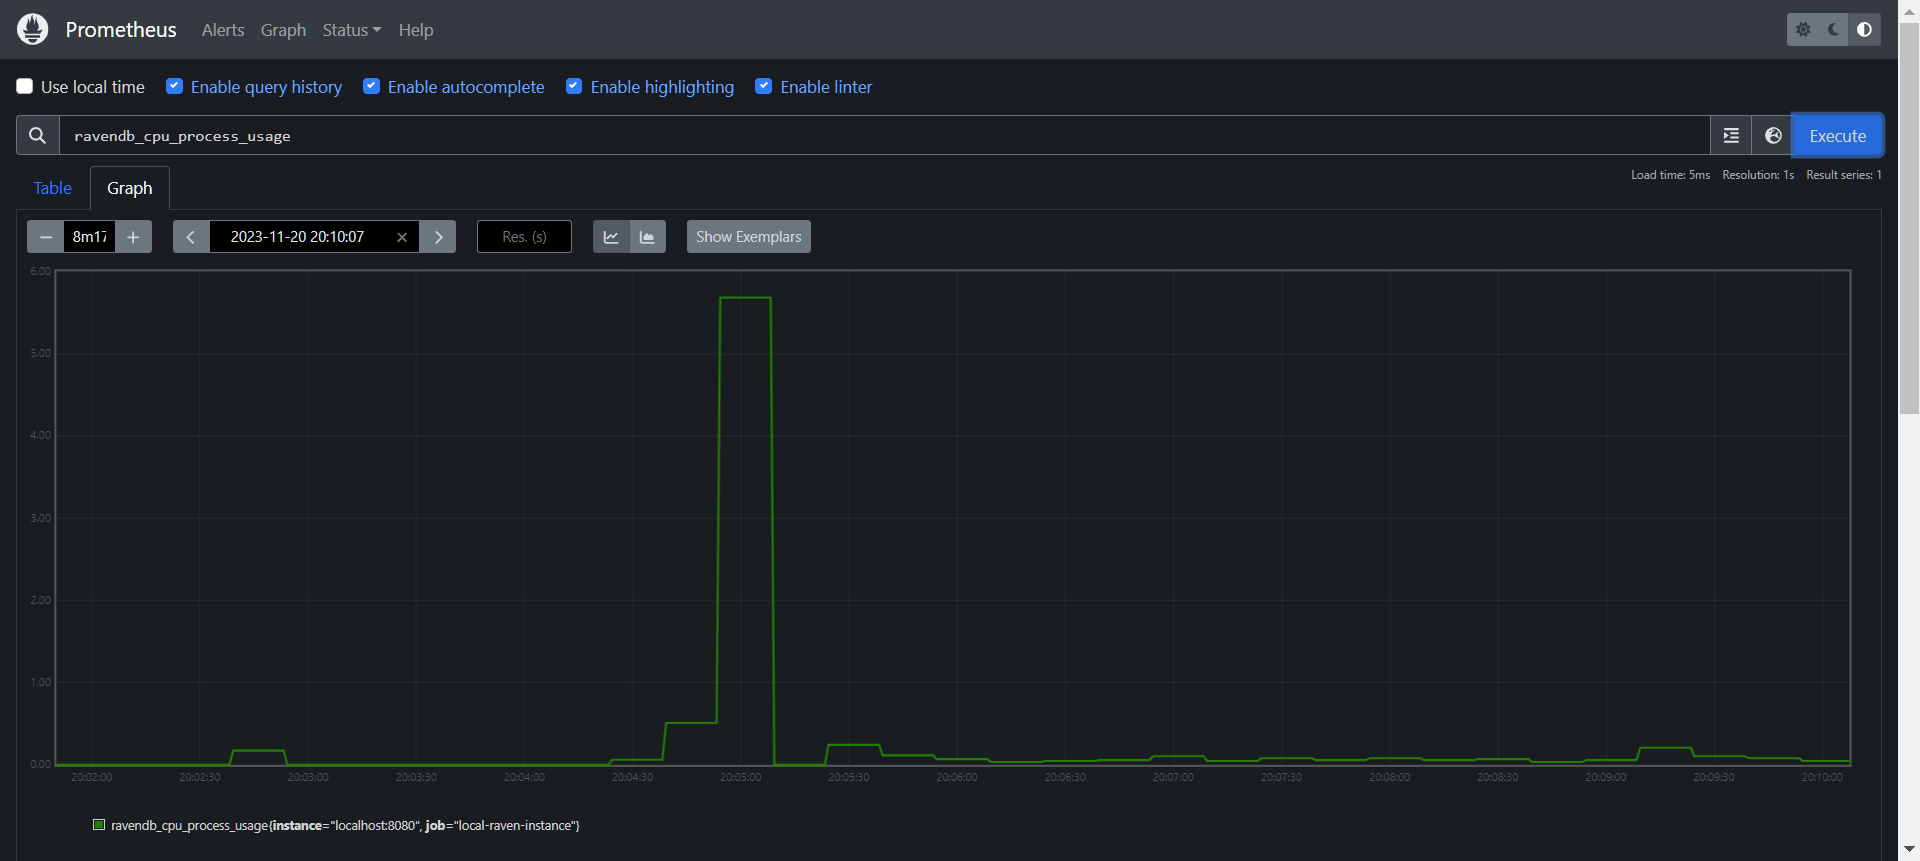
Executing a query over a metric plots its values over time in the Graph tab.
e.g., the RavenDB server's CPU usage:
Reading the endpoint output directly
You can also read the metrics directly from RavenDB's endpoint output, without Prometheus:
open the endpoint URL in your browser, as described under
RavenDB Prometheus Endpoint.
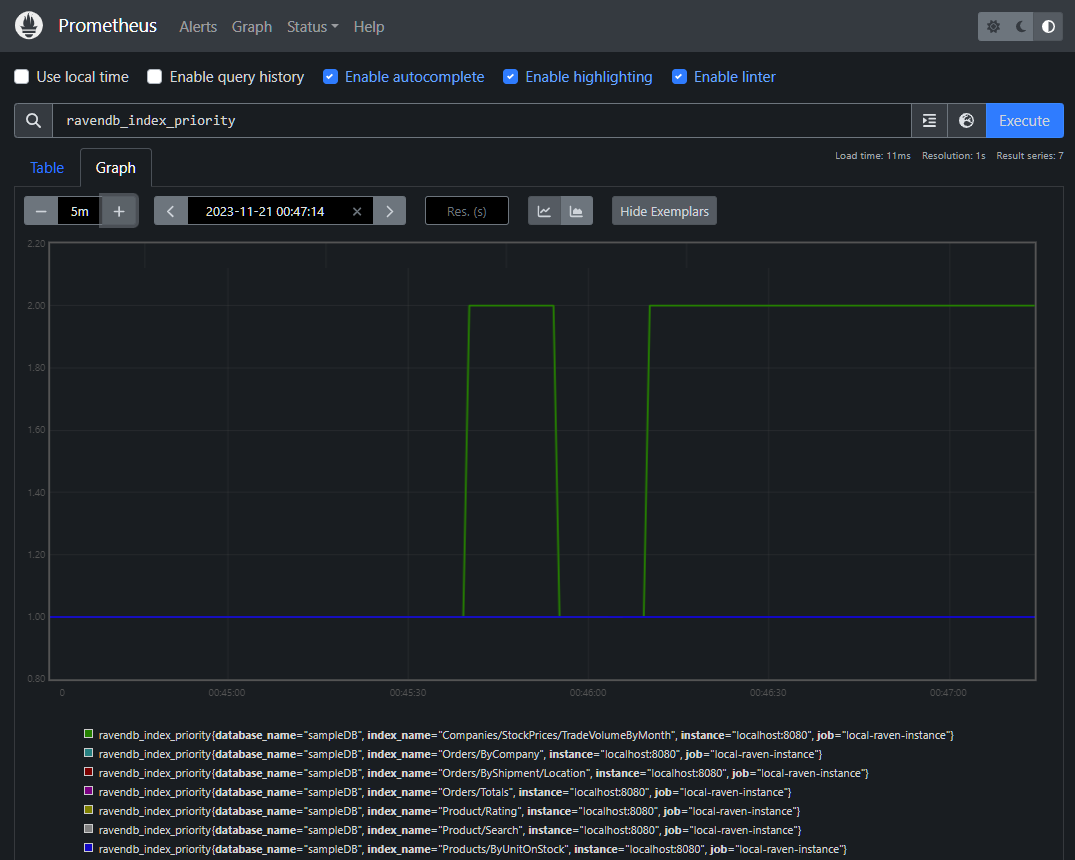
In the following endpoint output, the priority of one of the indexes was updated to 2 (high):

Querying the metric's name in Prometheus displays the change graphically:
Fetching Additional RavenDB Information
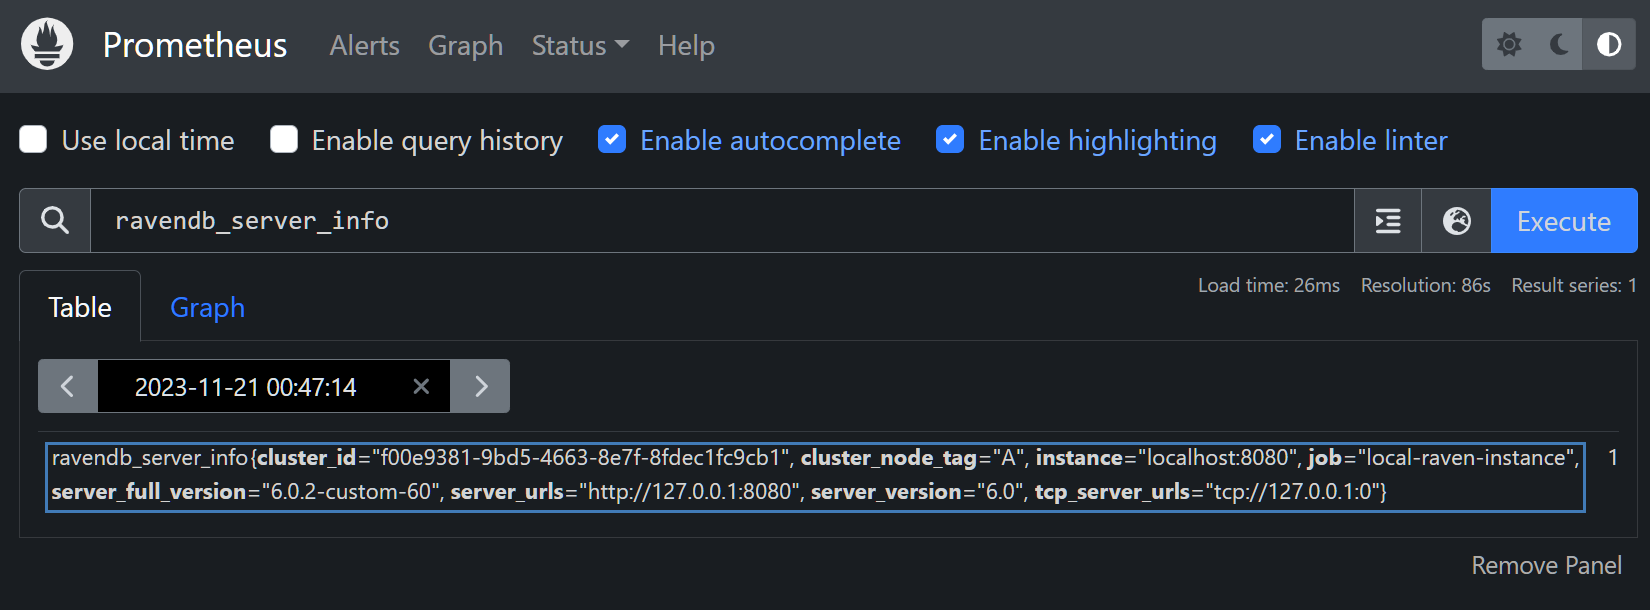
To retrieve additional information about RavenDB, including its version and its
HTTP and TCP URLs, query ravendb_server_info in Prometheus: