Debug: Stack Traces View
-
Studio's Stack Traces view captures the stack traces of all server threads at once, and draws the traces as a graph that groups threads running the same code.
Use this view to figure out the exact code a misbehaving server runs, for the current server or for the entire cluster. -
To capture the stack trace of a single thread rather than that of all threads, use the advanced-debug view's Threads Runtime Info tab.
-
Open the Stack Traces view from the
Manage Servermenu'sDebugsection. -
Capturing stack traces is not supported on macOS servers.
-
A captured stack graph is often much larger than the screen, and the images in this article show only a portion of the graph.
-
In this article:
The Stack Traces view
Clicking Capture takes one snapshot of every server thread, and displays the
collected stack traces as a graph.
Any user with an Operator or Cluster Admin
security clearance
can open the view.
Manage Server > Stack Traces
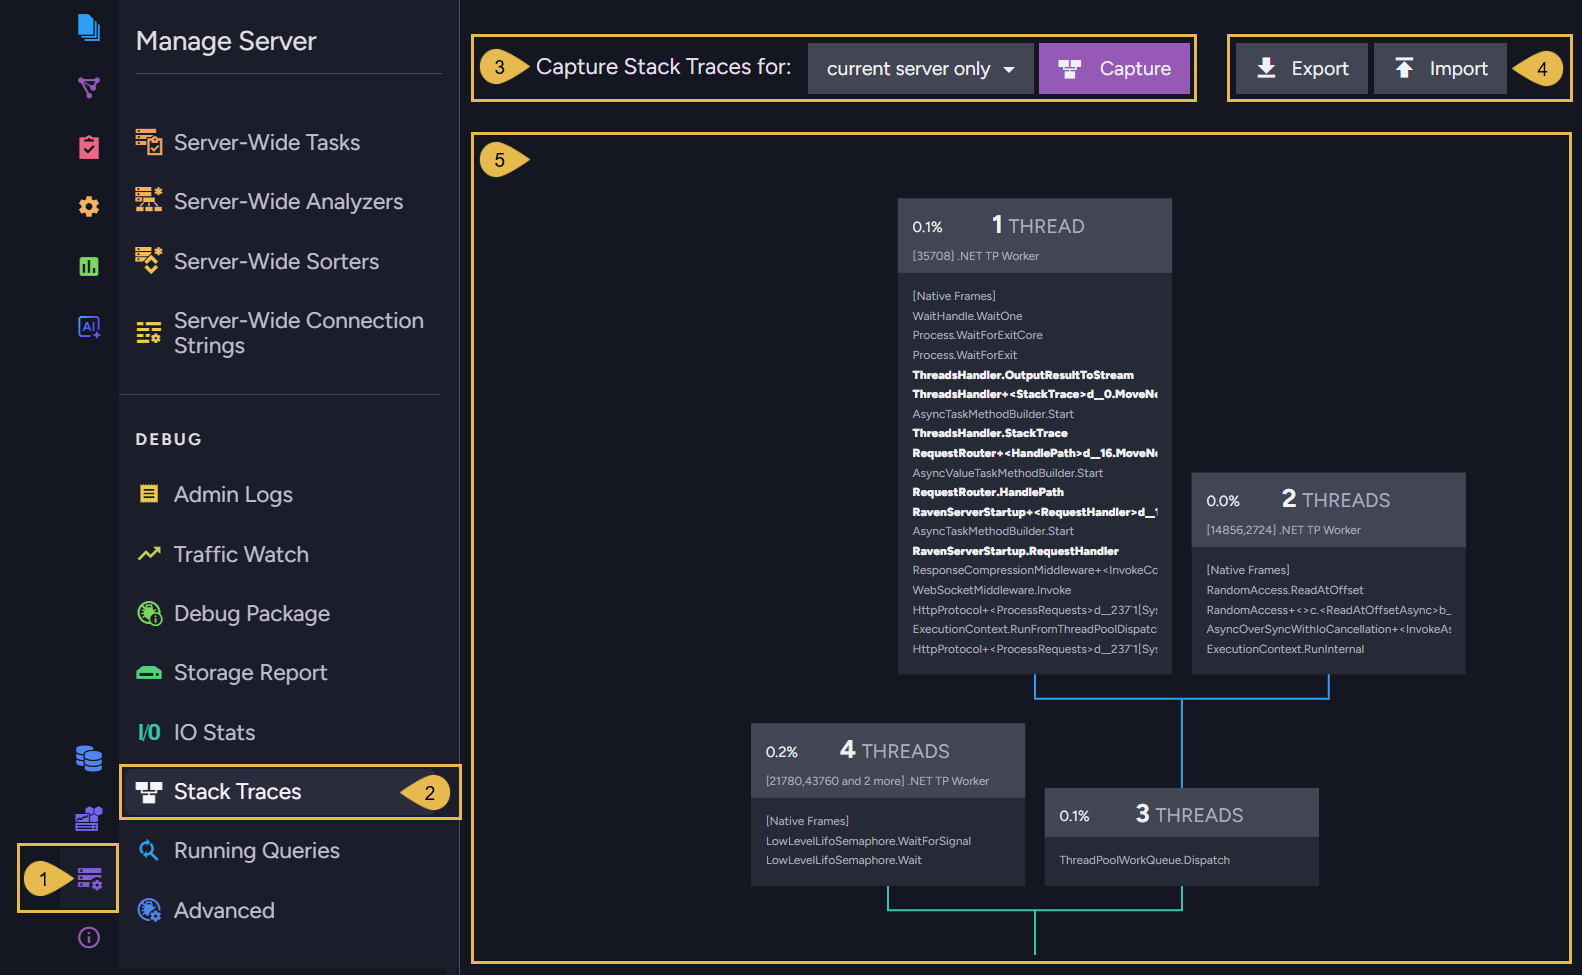
-
Manage Server
Open the Manage Server menu. -
Stack Traces
Open the Stack Traces view. -
Capture Stack Traces
Select capture scope: current server only, or entire cluster.
Click Capture to take the snapshot. -
Export and Import
Save a capture to a file or load a saved capture back into the view.
See Export and import below. -
The stack graph
The captured stack traces, drawn as a tree that groups threads running the same code.
See Reading the stack graph below.
Reading the stack graph
The stack graph gathers the captured traces into a tree:
- Each trace is a list of stack frames, one method call per frame, read from the bottom up: the method in each frame was called by the method in the frame beneath it.
- Traces that begin with the same method calls are merged: the shared frames are drawn in a single box, and the box branches upward into boxes that continue the separate ways the threads went.
- The tree, too, is read from the bottom up: the lowest box holds the methods all the threads started with, and the topmost frames hold the code the threads execute right now.
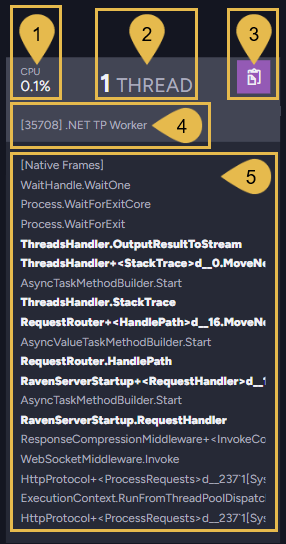
-
CPU usage
The CPU usage of the box's threads, summed. -
Thread count
The number of threads that execute the frames shown in this box. -
Copy
Copy the stack to the clipboard, including: the box's frames, followed by the frames of each box on the way down from this box to the bottom of the graph. -
Thread ID and name
Each thread is listed by its ID and name on the topmost box of its branch, the box that holds the thread's current code.
Threads RavenDB dedicates to a specific job are named after the job, e.g.,[26984] 'Orders' TxMTfor the thread that merges theOrdersdatabase's transactions; other threads carry the names the .NET runtime gives them, e.g.,.NET TP Workerfor a thread-pool worker.
Threads that share a name are listed together:[47060,40372 and 6 more] .NET TP Worker. -
The frames
The frames shared by the box's threads.
RavenDB's own methods are shown in bold, and the method names are shortened to fit the box: hovering over a frame for a moment shows it in full.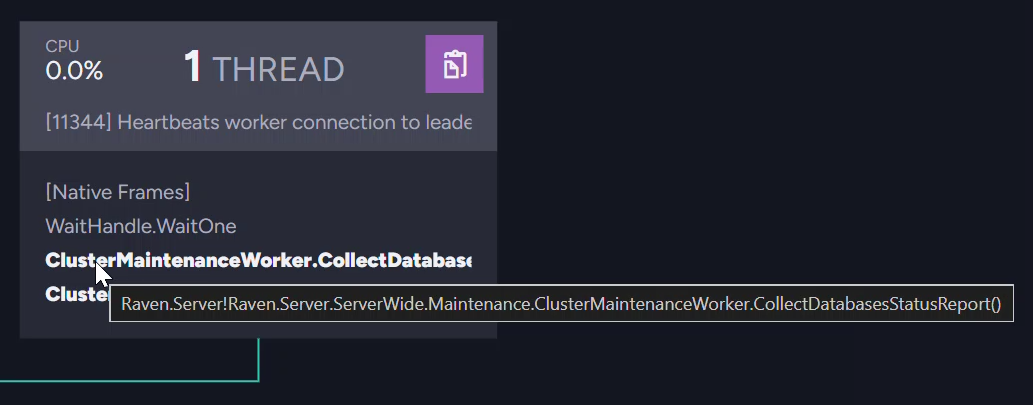
Zoom the graph with the mouse wheel, and drag it to move around.
Zooming far out shows the shape of the whole tree at a glance: boxes too small to read are
drawn as plain outlines.
Cluster-wide capture
Capturing the entire cluster takes the snapshot on every cluster node: each node captures its own threads, and the view collects the captures and displays them one node at a time.
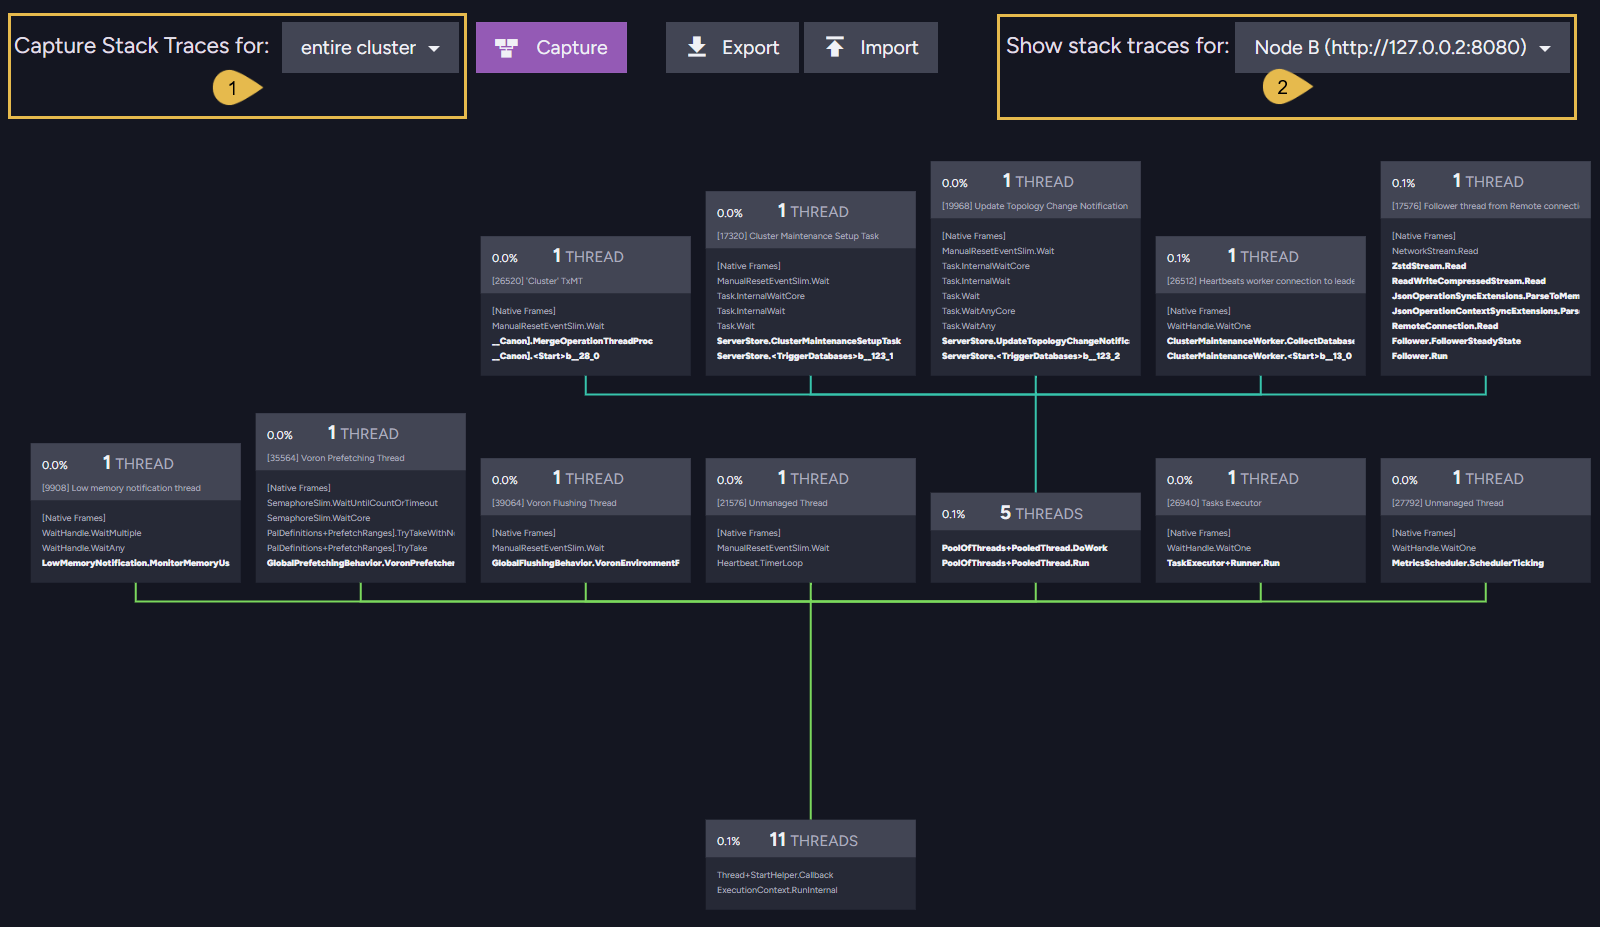
-
Capture scope
Set the scope to entire cluster and click Capture. -
Show stack traces
Select a node to display its capture.
If one of the nodes failed to capture its traces (a macOS server, for example), selecting this node shows the error instead of a graph.
Export and import
A capture is kept only in the view: leaving the view discards it.
Export a capture to keep it, and import saved captures to examine them at any time, on any
server: e.g., compare captures taken before and after a change, or read a capture taken on
a customer's cluster.

- Clicking Export saves the displayed capture to a JSON file.
The button is disabled until a capture is taken, and hidden when the view shows an imported capture (the capture already exists as a file). - Clicking Import loads a saved capture back into the view: a file saved with Export, or a stack-traces file extracted from a debug package.
The Debug Package Analyzer can also show a package's captures in this view directly: select a node's Performance Metrics > Threads tab and click Open in Stack Traces viewer.