Collecting Information for Support
-
When you encounter an incident or an issue with RavenDB, the support team needs relevant information to diagnose and resolve it.
-
This article describes what information to collect and how to collect it.
-
In this article:
Provide incident description
Provide the following details about the incident:
| Detail | What to provide |
|---|---|
| Description | A detailed description of the incident. Include any error messages, warnings, or unexpected behavior. |
| Exceptions | If an exception was thrown, attach the full exception stack trace, including the error message, as plain text. Specify the exception's origin, e.g., RavenDB Studio, the client, or the server logs. |
| Versions | Specify your RavenDB server, Studio, and client versions. |
Create debug package
Create the package
Studio's Debug Package view allows you to collect diagnostic information about your server or cluster into a debug package (a .zip file).
To create such a package, go to Manage Server > Debug Package and click Download package for entire cluster (or choose your current server
from the dropdown).
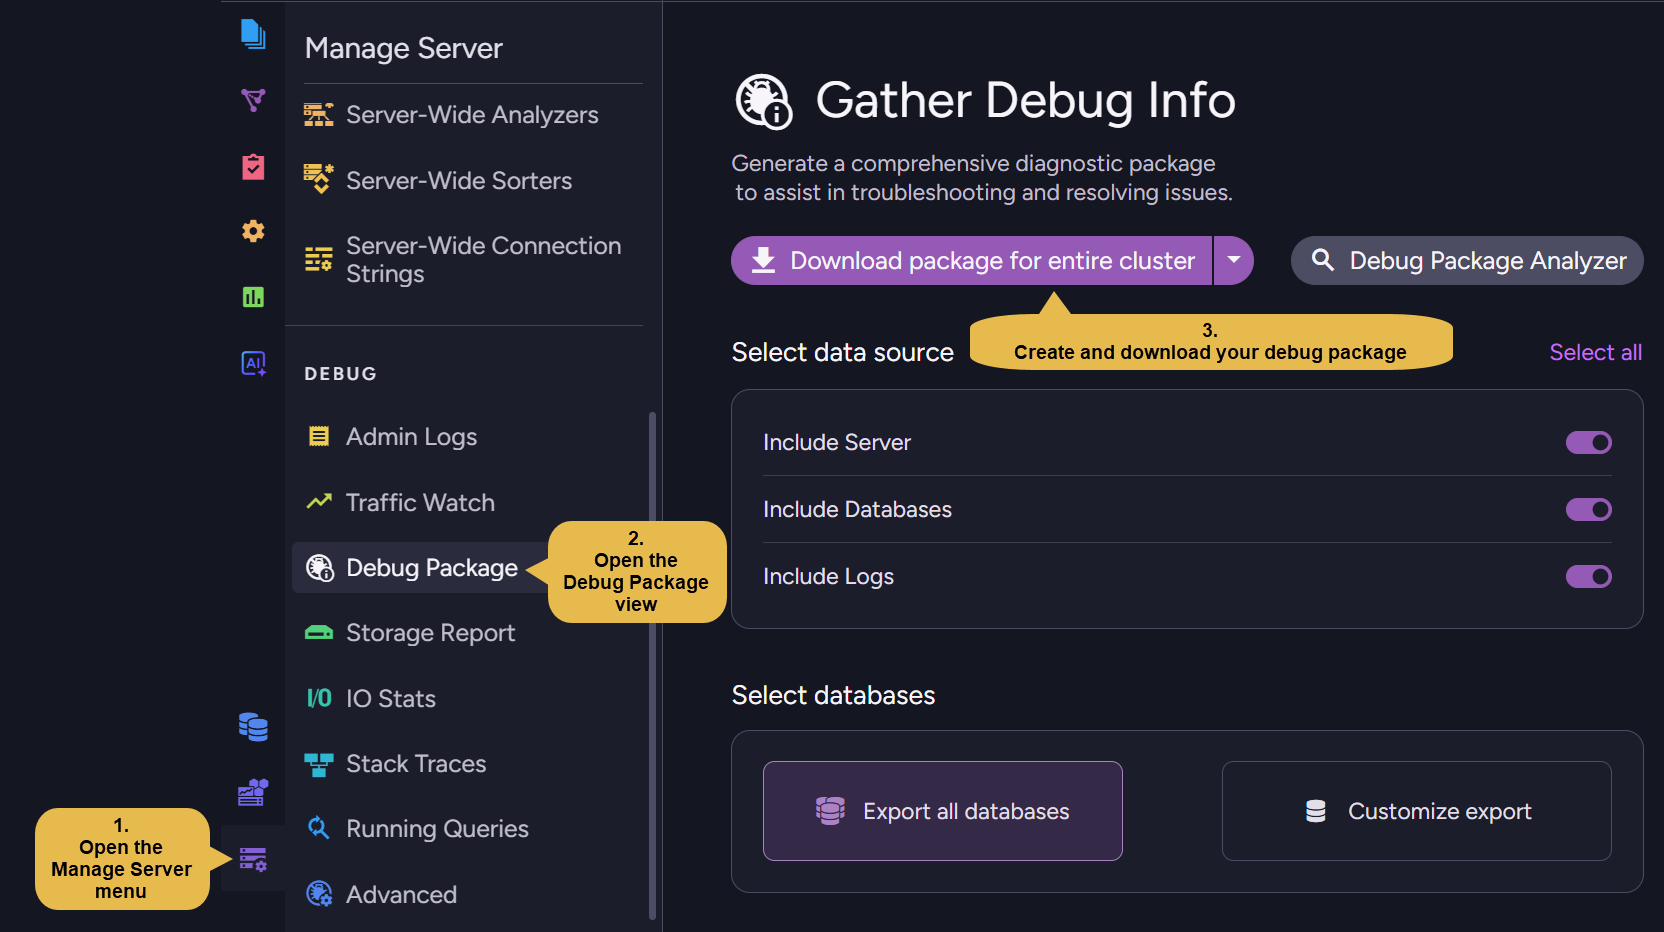
For the full walkthrough, see Create a Debug Package.
If Studio is unavailable:
-
Try to download the debug package by issuing an HTTP GET request to the following endpoint:
{SERVER_URL}/admin/debug/info-package. -
Execute this request for each cluster node, replacing
{SERVER_URL}with the relevant node's URL.
Verify the package
Before sending the debug package zip file, perform the following checks:
-
Verify that the zip file can be successfully extracted.
-
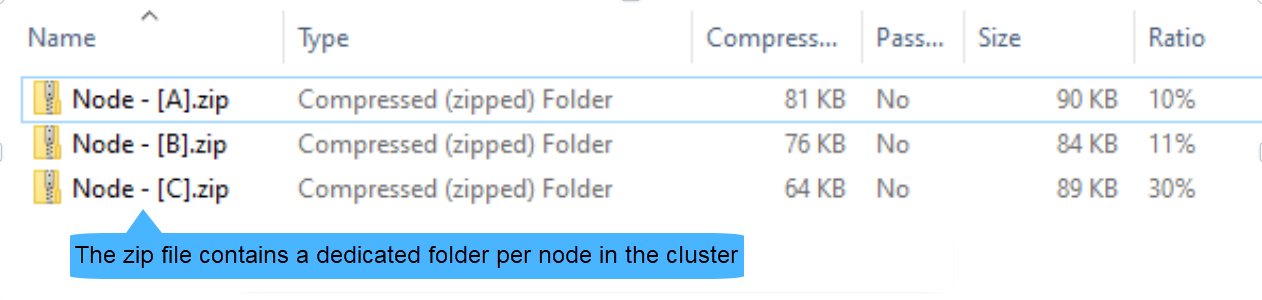
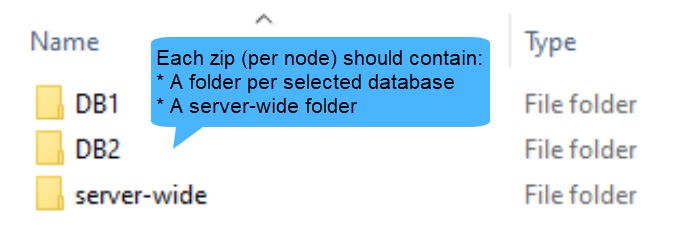
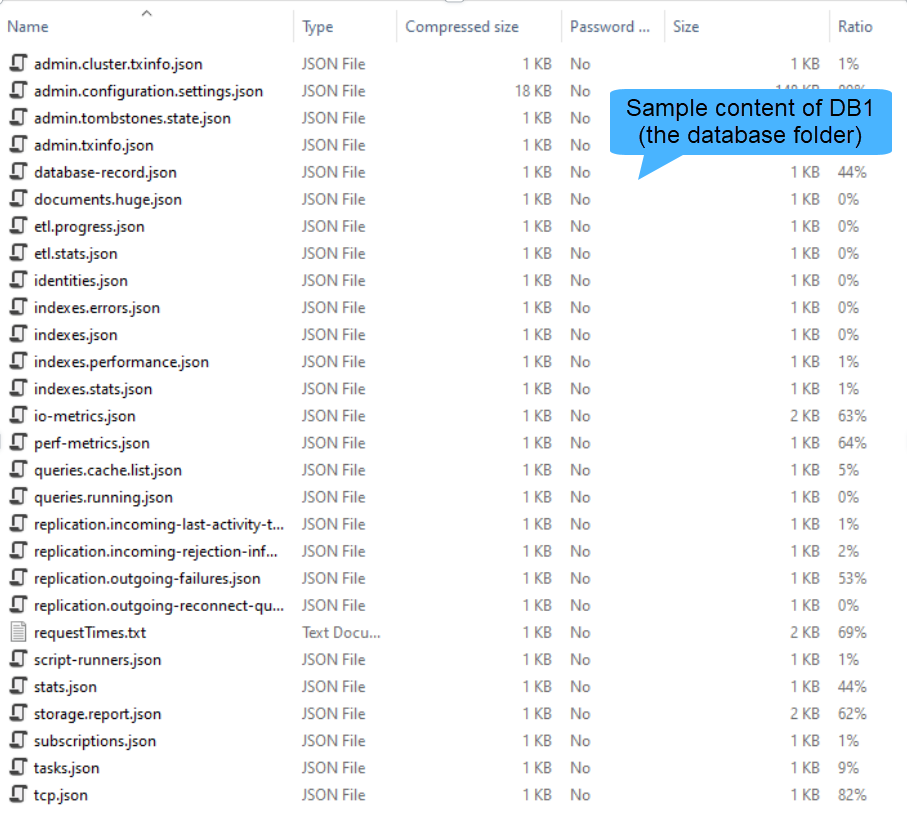
Verify that the content is similar to the following sample images:

Enable logs for ongoing issues
If the issue you're encountering is still ongoing, enable debug-level logging on disk as follows (if not already enabled) to capture helpful information, before downloading the log files.
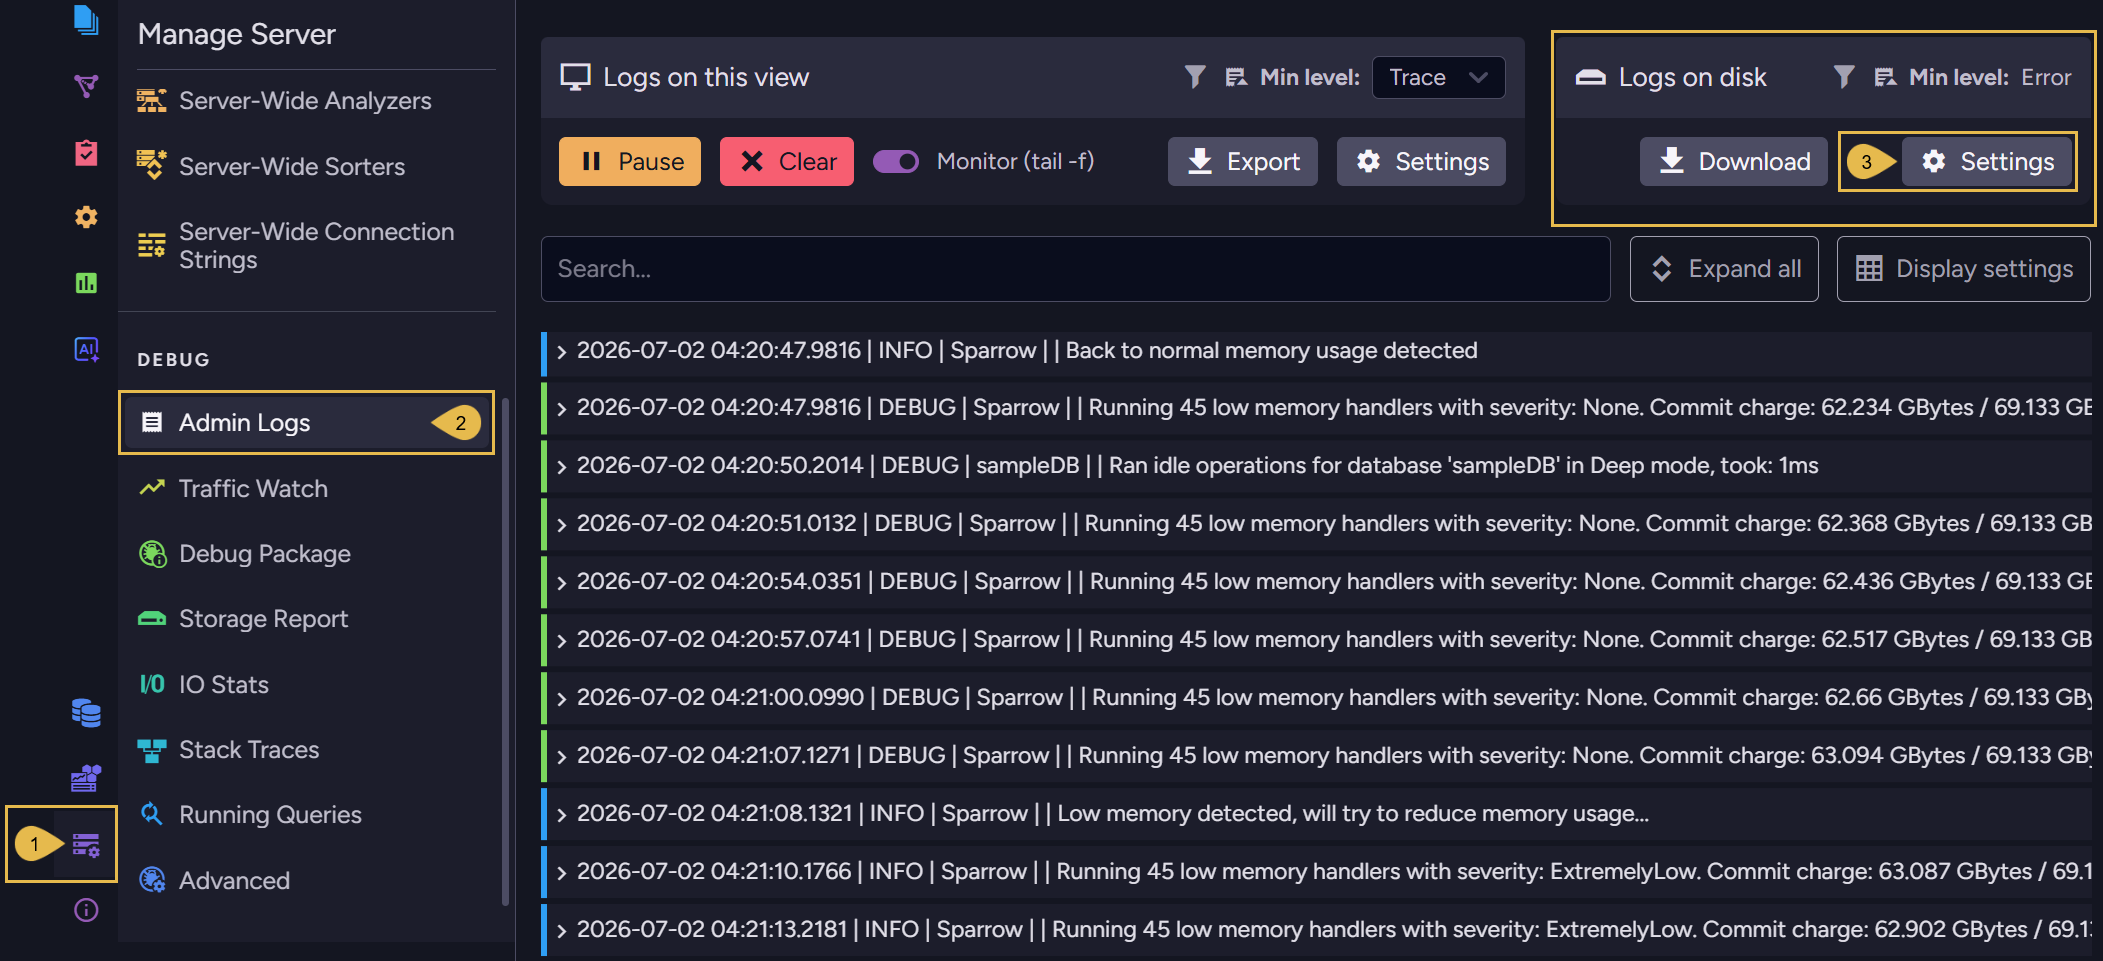
-
Navigate to Manage Server.
-
Open the Admin Logs view.
-
Click Settings in the "Logs on disk" section.
The following Settings dialog will open: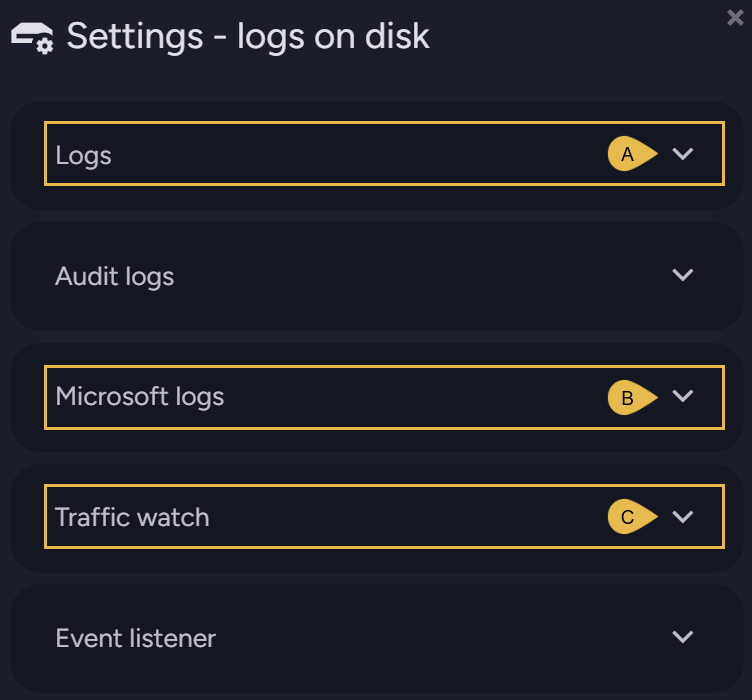
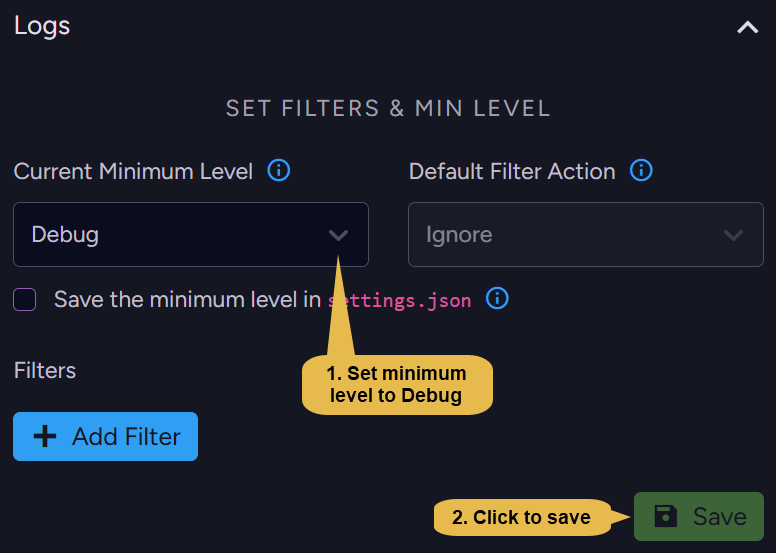
A. Click to open the Logs (server logs) dialog and change logging level to Debug:
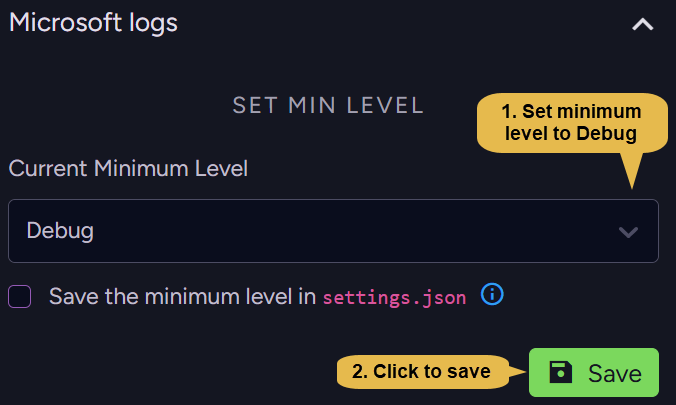
B. Click to open the Microsoft logs dialog and change logging level to Debug:
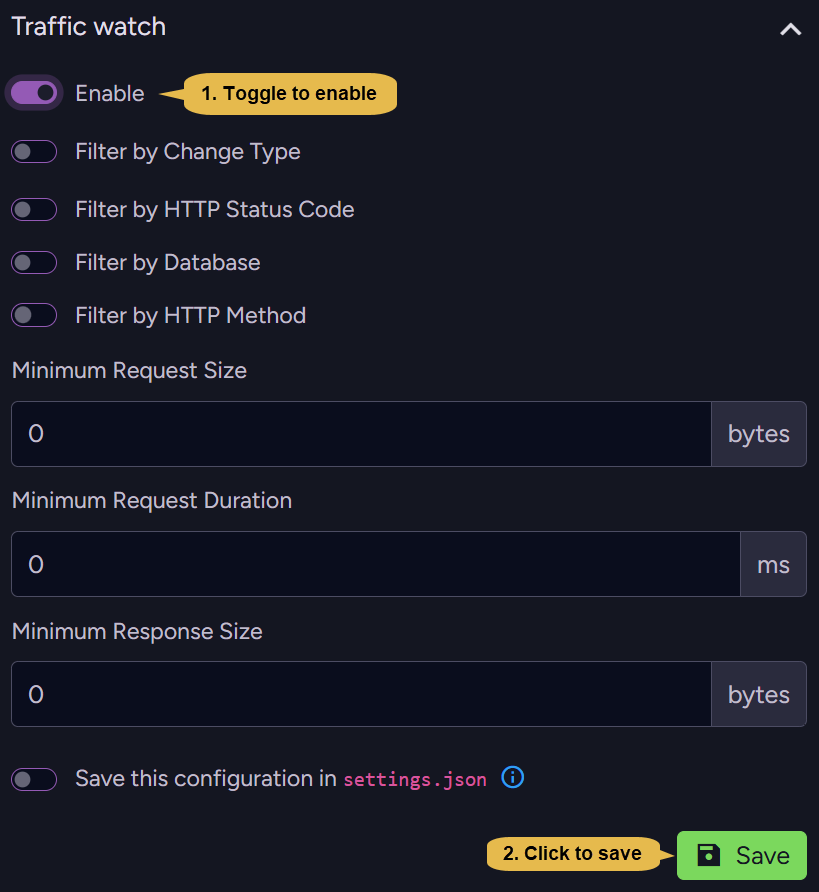
C. Click to open the Traffic watch dialog and enable logging:
Be aware that a server restart will reset all log settings to their default values.
To preserve your settings even through a restart, either:
-
Save the settings via Studio:
Open each log type dialog, check the "Save ... insettings.json" checkbox, and save.
Note: the exact checkbox label varies between the log types.
e.g.,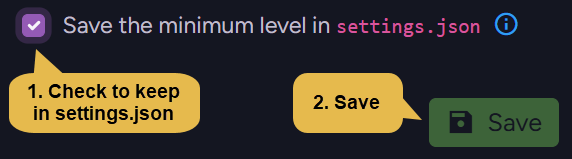
-
or Set the relevant configuration key as described in the configuration overview:
- For Server logs: set the Logs.MinLevel configuration key.
- For Microsoft logs: set the Logs.Microsoft.MinLevel configuration key.
- For Traffic watch logs: set the TrafficWatch.Mode configuration key.
Download logs
Download the logs
Perform the following for each cluster node:

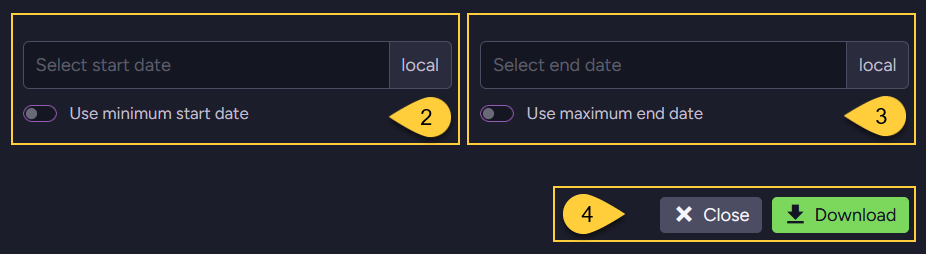
-
Navigate to
Manage Server>Admin Logsand click 'Download' in the "Logs on disk" section. -
Either check 'Use minimum start date' to retrieve logs information from the time the server was started,
or enter a specific (local) time. -
Either check 'Use maximum end date' to retrieve logs information up to the current time,
or enter a specific (local) time. -
Click 'Download'.
A zip file containing the logs will be downloaded.
If Studio is unavailable, or the logs downloaded via Studio appear erroneous,
copy the log files directly from disk to another location to ensure they are kept,
avoiding potentially losing them due to retention policy.
-
Log files location is set by the Logs.Path configuration key.
-
Logs deletion is controlled by the following configuration keys:
Verify the logs
Before sending the log files, perform the following checks:
-
Verify that the zip files can be successfully extracted.
-
Confirm that the logs correspond to the time of the incident.
-
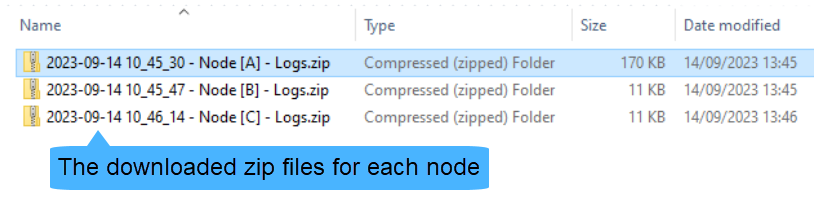
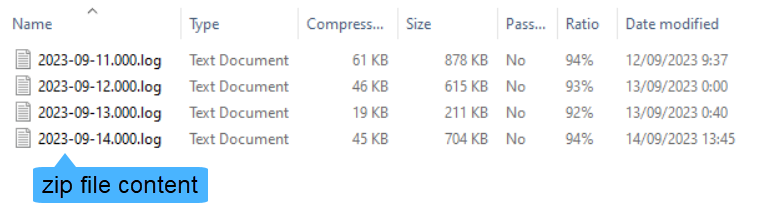
Verify that the content is similar to the following sample images:
Reproduce scenario
-
If the incident is over and you can reproduce it, verify first that the logging level is set to 'Debug'.
-
See how to enable the logs in Enable logs.
Create failing test
-
If possible, it is advised to create a unit test that showcases the failure in your client code.
-
Refer to Writing your unit test to learn how to use RavenDB's TestDriver.