Cluster Dashboard: Overview
-
The Cluster Dashboard Studio view presents live diagnostics for a whole RavenDB cluster.
-
Each widget on the dashboard shows a set of metrics, gathered from every cluster node.
See Available widgets for the full set. -
You can customize the dashboard by adding, removing, resizing, and repositioning its widgets.
See Customizing the dashboard. -
In this article:
The Cluster Dashboard view
The Cluster Dashboard view shows a live overview of an entire RavenDB cluster.
Each widget shows a set of metrics gathered from every node, so you can follow CPU, memory,
storage, traffic, and indexing across the whole cluster without opening each node separately.
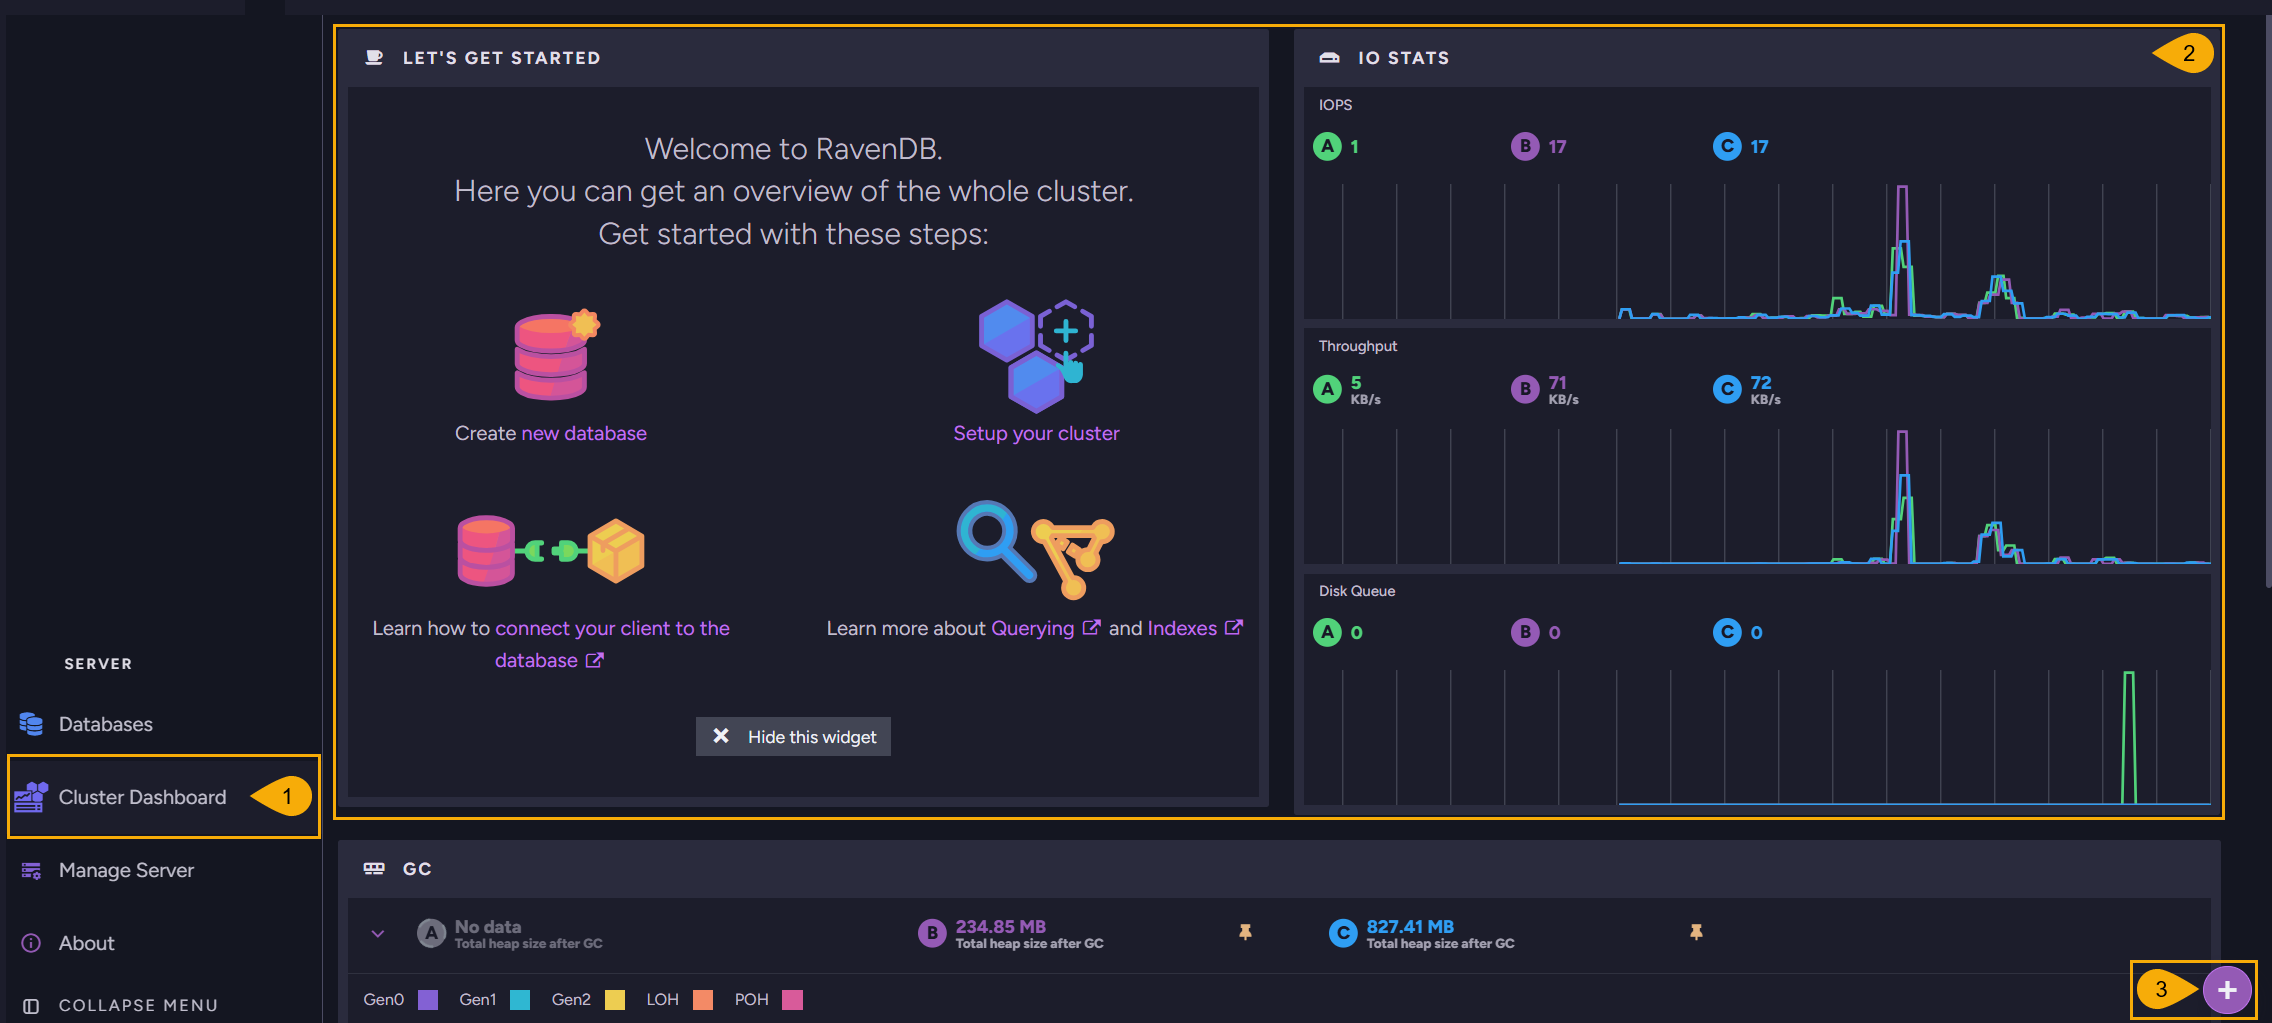
-
Cluster Dashboard
Open the cluster dashboard view. -
Widgets
Each widget shows a set of live cluster metrics.
See Available widgets for the full set. -
Add widget
Click to add a widget to the dashboard.
See Customizing the dashboard for more about arranging widgets.