Alerts and Notifications: Notification Center
-
The Studio notification center presents alerts, performance hints, reports of running operations, and errors, raised by the server or by Studio itself.
-
Open the notification center using the bell button, shown at the top of every Studio view.
-
Each cluster node keeps its own notifications: the notification center shows the notifications of the node that Studio is connected to.
To read another node's notifications, open that node's Studio. -
In this article:
Overview
RavenDB reports events that need your attention by raising notifications: a failing backup
task, for example, raises an alert, a query that returns an excessive number of results raises
a performance hint, and a lengthy patch operation reports its progress.
The notification center collects these notifications and presents them in one panel.
Learn below
about each notification type, the actions it offers, and its lifetime.
Alerts and performance hints are stored by the node that raised them: they remain available
through server restarts and browser refreshes until you dismiss them.
Reports of operations and errors are more short-lived, and most are gone once the Studio
browser tab is closed or refreshed.
Server-wide and database notifications
A notification applies either server-wide or to a specific database.
The icon beside the notification's title shows its scope: a globe for a server-wide
notification, and a database icon for a notification that concerns a specific database.
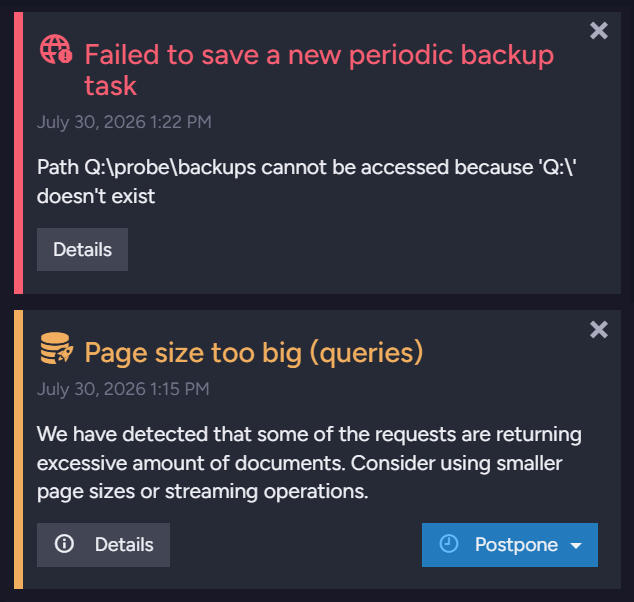
The notification center lists server-wide notifications as well as notifications for the
database you are working on.
Moving to another database replaces the database notifications and keeps the server-wide
notifications.
The notification center panel
To open the notification center, click the bell button, shown at the top of every Studio view.
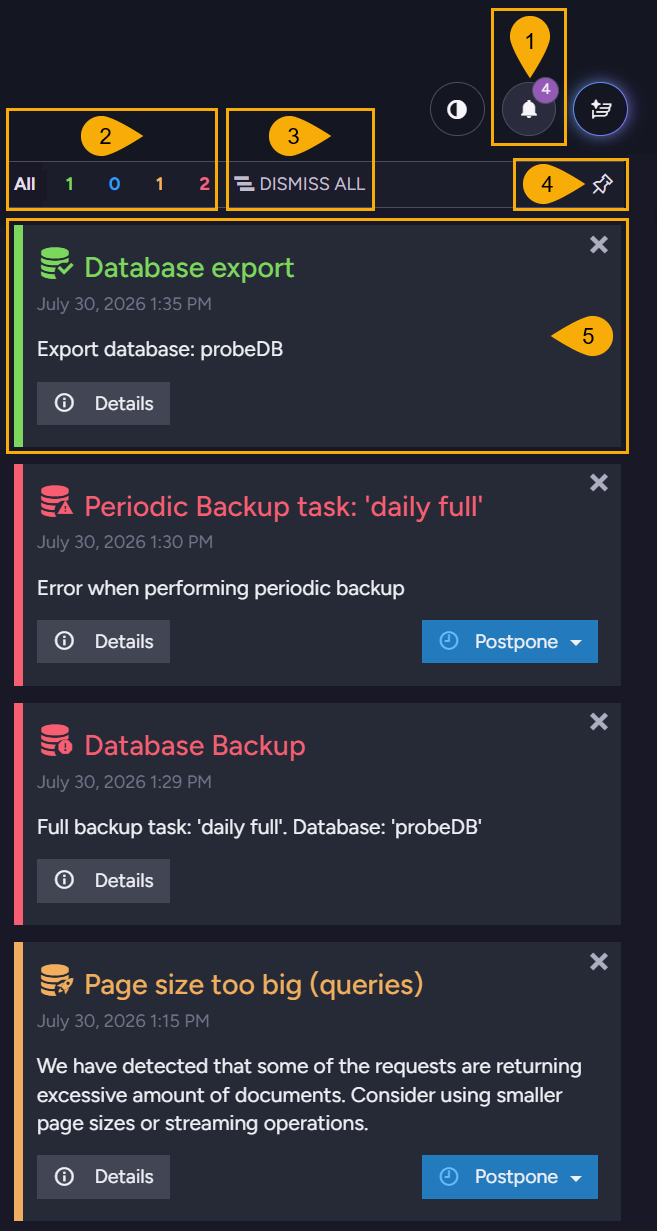
-
Notification center button
Open and close the notification center.
The counter on the bell shows the number of notifications the notification center currently holds. -
Severity filter
Each numbered button counts the notifications of one severity.
Click a number to list only the notifications of the selected severity, orAllto remove the filter.Severity Color Typical notifications Success Green Completed operations (e.g., a finished database export). Info Blue Informational performance hints (e.g., a slow-writes report). Warning Orange Most performance hints, canceled operations, and alerts (e.g., a potential GC slowdown). Error Red Failed operations, Studio errors, and alerts (e.g., a failed backup). Note that a running operation carries no severity yet: its report is listed only while
Allis selected. -
Dismiss all
Dismiss every notification in the notification center, including notifications hidden by the severity filter. -
Pin
Keep the notification center open: while pinned, it is docked beside the view area and stays open as you work elsewhere in Studio. -
Notifications
Each notification is presented as a card, colored by its severity, with the notification's title, timestamp, message, and the actions available for this notification.
Learn below about the notification types and the actions each type offers.
Notification types
The notification center presents four types of notifications:
| Type | Description |
|---|---|
| Alerts | Server conditions that require your attention. |
| Performance hints | Inefficiencies the server detects, and advice for handling them. |
| Operations | The progress and results of long-running operations. |
| Studio errors | Errors Studio encounters while you work. |
Alerts
The server raises an alert when a condition requires your attention, like a failed backup task, an ETL task that cannot reach its destination, a certificate nearing its expiration, or low disk space.
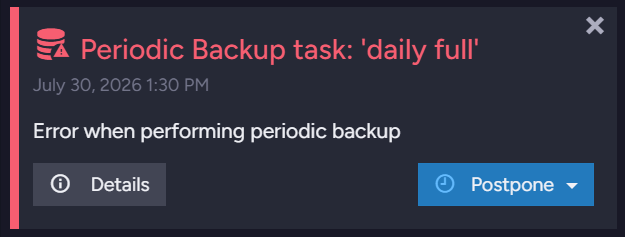
Each alert carries a severity: the failed backup shown above is an Error alert, and a potential
GC (Garbage Collection) slowdown is a Warning.
Click Details for the full report, including any exception the server recorded.
Note that license-related alerts cannot be postponed, and the license-agreement alert cannot be dismissed.
Performance hints
The server raises a performance hint when it detects an inefficiency you can remove, like a
query that retrieves an excessive number of results, an oversized document, or an index with a
high fanout ratio.
The hint describes the detected condition and suggests a remedy.
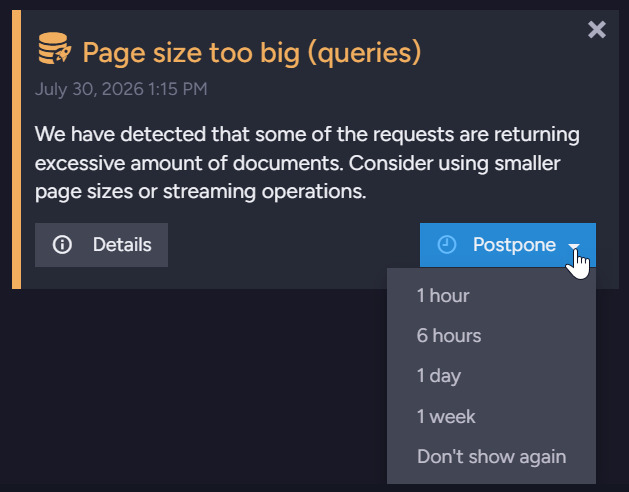
Open Postpone to postpone the hint for a set period, or select Don't show again to hide the
hint permanently, even if the condition recurs.
A hint that recurs does not raise a new notification: each new occurrence is recorded in the
existing hint's details.
Click Details to list the recorded occurrences:
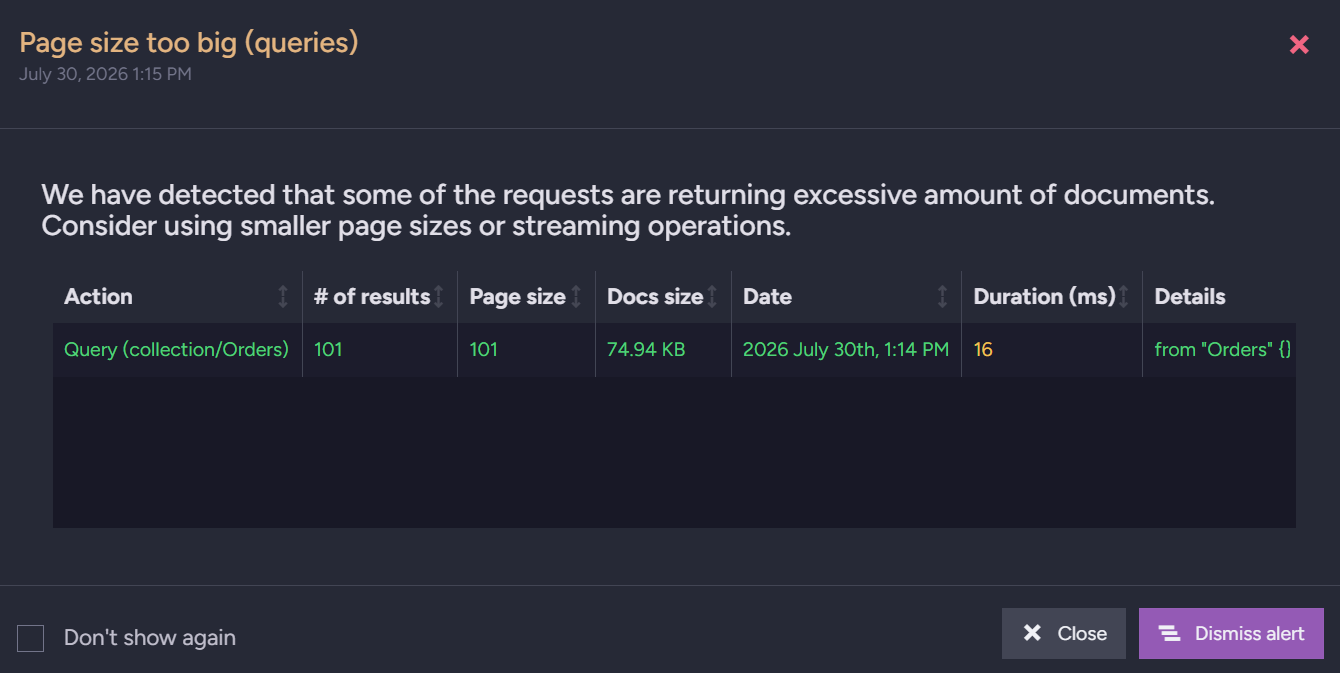
The dialog's Don't show again checkbox works like the Postpone option: check the box and
click Dismiss alert to hide the hint permanently.
Learn in the Performance hints article about the hints the server raises and the conditions they report.
Operations
Operations that you start, like a collection-wide patch, a database import or export, or a restore, report their progress and results to the notification center.
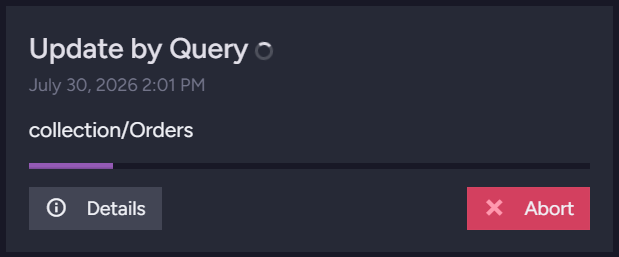
While an operation runs, its card shows a progress bar when the operation's progress can be
measured, and a red Abort button if the operation can be aborted.
Click Abort to cancel the operation; Studio asks you to confirm first.
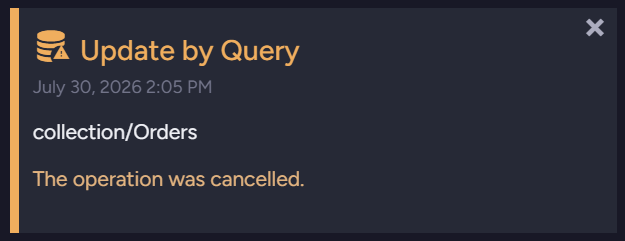
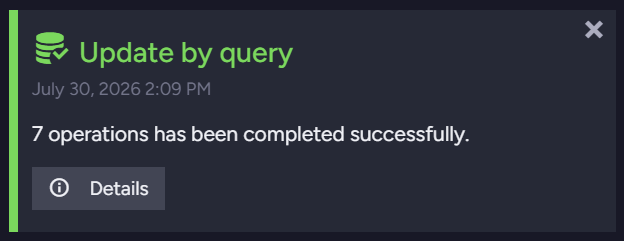
A canceled operation is reported as a warning, a failed operation as an error, and an operation that completed successfully as a success:
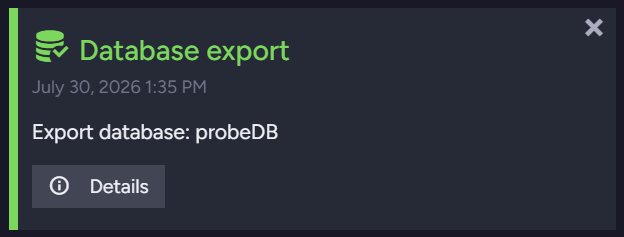
An operation's card remains listed in the notification center until you dismiss it, but does not survive a browser refresh: after a refresh, the notification center lists again only operations that are still running, and the results of a few operation types that the server stores, like a database import, export, or restore.
Repeated bulk operations do not create multiple cards in the notification center: completed runs of the same kind (a bulk insert, an update by query, or a delete by query) are merged into a single card that counts them.
Studio errors
A failed Studio action, like an attempt to save a misconfigured task or to run a malformed query, raises an error notification.
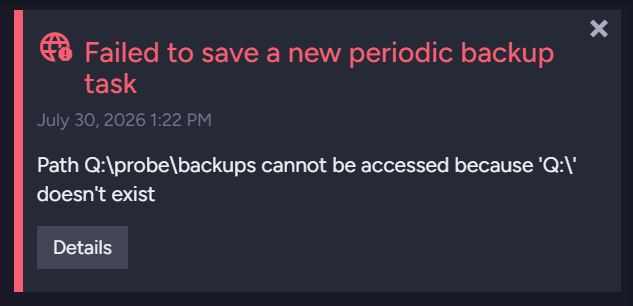
Unlike the other notification types, Studio errors are raised by Studio itself, in your
browser, and are never stored by the server: an error remains listed in the notification
center until you dismiss it or the browser page is refreshed.
Click Details for the full error message.
Note that Studio errors always carry the globe icon, even when the failed action concerns a specific database.
Dismissing and postponing
Each notification card carries an X button; click it to remove the notification from the
notification center.
To remove all notifications at once, click Dismiss all, shown in
The notification center panel
above.
Dismissing removes the notification, not its cause: a condition that persists or recurs raises
a new notification.
Alerts and performance hints also carry a Postpone button, shown open in
Performance hints
above.
Select a period (1 hour, 6 hours, 1 day, or 1 week) to hide the notification for this
period: the notification stays hidden even if its condition recurs, and returns when the
period ends.
A performance hint's postpone options also include Don't show again, hiding the hint
permanently.
Access requirements
-
Users of every security clearance can open the notification center.
-
Users with
Userclearance see only the notifications of the databases their certificates grant access to.
Server-wide notifications are shown only to users withOperatororCluster Adminclearance. -
Dismissing or postponing a database's notifications requires write access to the database.
Users whose access level is Read Only can read notifications, but cannot postpone them, and can dismiss only notifications the server does not store, like a Studio error. -
On an unsecure server, these restrictions do not apply.
Configuration
To keep chosen notifications from appearing in the notification center, list them in the
Notifications.FilterOut configuration key.
| Configuration key | Description |
|---|---|
Notifications.FilterOut | A semicolon-separated list of notifications that the server drops. A dropped notification is neither stored nor shown. Each entry names a whole notification type (e.g., PerformanceHint), a performance-hint reason (e.g., SlowIO), or an alert reason (e.g., Server_NewVersionAvailable). The three name sets are described below.Default: null (no notification is dropped). |
The key is server-wide and cannot be set for a specific database. Set it in the server's
settings.json file; the change applies after a server restart.
Notifications raised before the key was set remain listed: dismiss them once, and the filter
stops further occurrences from appearing.
Example: Filter out a hint reason and an alert reason
{
    "Notifications.FilterOut": "SlowIO;Server_NewVersionAvailable"
}
Values for notification types
To filter out all the notifications of one type, list the type:
| Type | Filters out |
|---|---|
AlertRaised | All alerts |
PerformanceHint | All performance hints |
OperationChanged | All operation reports |
RecentError | Studio errors. The server never raises this type, so listing it has no effect. |
DatabaseStatsChanged | Internal statistics updates that keep Studio's collections view current |
DatabaseChanged | Internal updates about database record changes, like a database being created or deleted |
ClusterTopologyChanged | Internal updates about changes in the cluster topology |
NotificationUpdated | Internal events that synchronize dismissing and postponing between open Studio sessions |
Note that Studio relies on the internal types to keep its views current: filtering them out disables these updates.
Example: Filter out all performance hints
{
    "Notifications.FilterOut": "PerformanceHint"
}
Values for performance-hint reasons
To filter out only the hints raised for a specific reason, list the reason:
| Reason | Filters out hints about |
|---|---|
Paging | Requests that return an excessive number of results |
RequestLatency | Queries whose duration exceeds the configured threshold |
UnusedCapacity | A server that uses fewer cores than the machine provides |
SlowIO | Extremely slow disk writes |
HugeDocuments | Documents that exceed the configured size |
SqlEtl_SlowSql | Slow SQL statements in a SQL ETL task |
Indexing | Indexing performance issues, like a high fanout ratio |
Indexing_References | A high rate of LoadDocument() calls per referenced item |
Replication | Tombstone accumulation caused by a disabled replication destination |
Example: Filter out the paging and slow-writes hints
{
    "Notifications.FilterOut": "Paging;SlowIO"
}
Values for alert reasons
To filter out only the alerts raised for a specific reason, list the reason.
An alert's reason is not shown on its card. To find the reason, fetch the server's stored
notifications from the /admin/server/notifications
debug endpoint (requires Operator clearance),
or a database's notifications from /databases/<database name>/notifications (requires access
to the database), and read the alert's Reason field.
e.g., the swap-on-HDD alert filtered in the example below appears in the endpoint's output as (among other fields):
{
    "Type": "AlertRaised",
    "Title": "Swap Storage Type Warning",
    "Reason": "SwappingHddInsteadOfSsd"
}
Example: Filter out three routine alerts
{
    "Notifications.FilterOut": "Server_NewVersionAvailable;LicenseManager_LeaseLicenseSuccess;SwappingHddInsteadOfSsd"
}