Zabbix monitoring
-
Zabbix is an open-source monitoring system. It periodically reads metrics from the servers and applications you point it at, stores their values over time, plots graphs, and raises alerts each time a value crosses a threshold you have set.
-
The Zabbix community template for RavenDB is a YAML file that you import into your Zabbix server once.
The template lists SNMP queries Zabbix should use to read RavenDB's metrics, alert rules that go with those metrics, graphs the Zabbix frontend should draw, a ready-made dashboard, and configurable memory thresholds.
Without the template, you would have to define each query and each alert rule in Zabbix by hand. -
The template is community-maintained, not part of the RavenDB product. For a list of available templates or to contribute a template of your own, see the community-templates repository.
-
Zabbix reads RavenDB's metrics over SNMP, so SNMP must be enabled on RavenDB before Zabbix can reach it.
See SNMP Support for the RavenDB-side configuration. -
This page covers: importing the template into Zabbix, acquainting Zabbix with your RavenDB server, checking that metrics are arriving from the server, and reviewing the alerts the template defines.
-
For a step-by-step walkthrough that also covers setting up Zabbix in Docker and pointing it at a RavenDB Cloud instance, see Set up Zabbix monitoring for RavenDB Cloud.
-
In this article:
Prerequisites
Before Zabbix can monitor RavenDB, three things have to be in place:
-
A running Zabbix instance (version 6.0 or later), with administrative access to the Zabbix web frontend.
If you haven't set an instance yet, the Set up Zabbix monitoring for RavenDB Cloud guide can walk you through setting it up in Docker. -
RavenDB with SNMP enabled.
SNMP requires a RavenDB Enterprise license.
To turn SNMP on, setMonitoring.Snmp.Enabledtotrueinsettings.jsonand restart the server.
See SNMP Support for the SNMPv2c / SNMPv3 credentials and other configuration. -
Network access between Zabbix and RavenDB.
Zabbix sends its SNMP queries to RavenDB over UDP on port 161 (the default SNMP port).
The network path between them must allow UDP traffic; a firewall configured for TCP only will block the queries.
The menu names in this page follow Zabbix 6.4 and later.
On Zabbix 6.0 LTS, Data collection is named Configuration, and Alerts and Users are found under Administration.
Importing the template
To monitor RavenDB without defining every query and alert by hand, import a template: a monitoring configuration you attach to any host.
Import the file into Zabbix once.
From then on, every host you link to the template inherits its queries, alert rules, and graphs.
The RavenDB template is published in the Zabbix community-templates repository. To install it:
- Download
template_ravendb_server.yamlfrom Databases/RavenDB/template_ravendb_server/6.0/
(6.0here is the Zabbix version, not RavenDB. The template requires Zabbix 6.0 or later). - In Zabbix, open
Data collection>Templatesand selectImport. - Choose the downloaded YAML file and select
Import.
After the import, the template appears in the Templates list as RavenDB server:
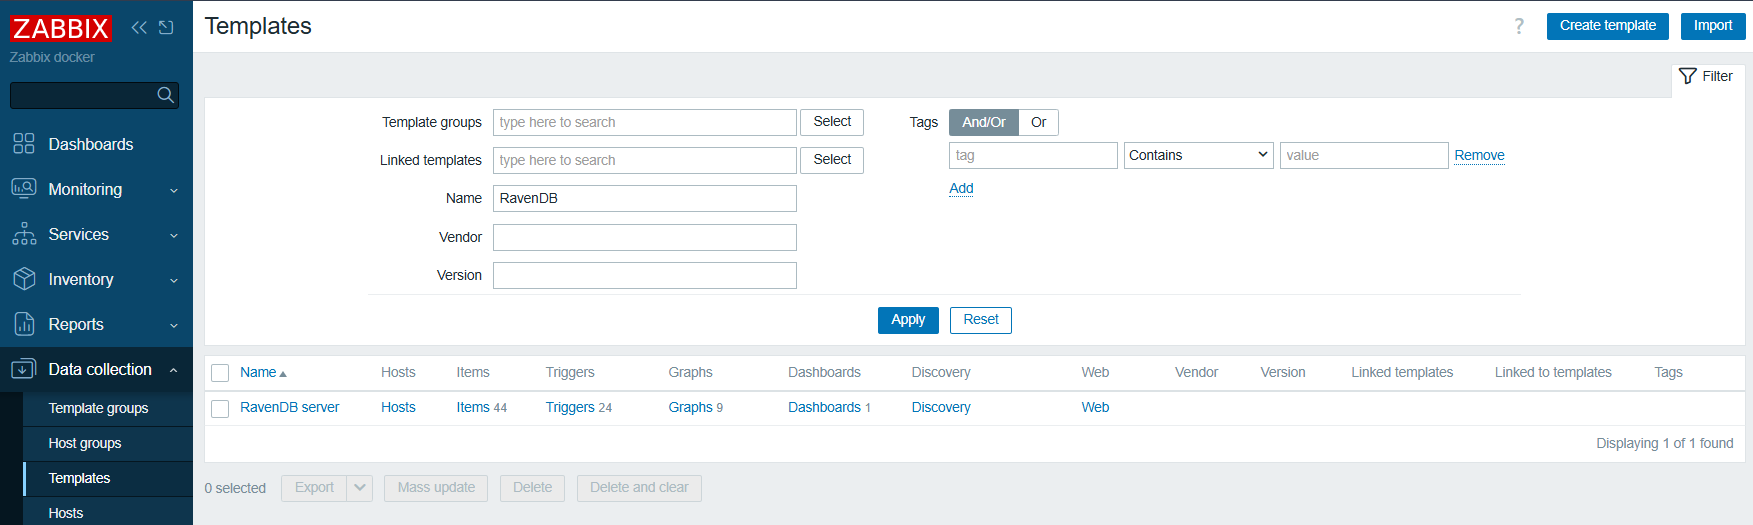
The template's full inventory is documented in the community template README. The Templates list above shows how many items, triggers, graphs, and dashboards come with the version you imported.
Creating a host
To start monitoring a RavenDB server, tell Zabbix about it by creating a host.
A host is any target Zabbix watches: a server, a network device, an application.
Create one host per RavenDB server, link the RavenDB template to that host, and configure the host's SNMP interface so Zabbix can reach the server.
Configuring the SNMP interface
In Zabbix, open Data collection > Hosts and select Create host.
Fill in the form:
- Host name
Any name you choose. Zabbix uses it internally and in alert texts.
Example:RavenDB dev playground. - Templates
Add theRavenDB servertemplate you imported earlier. - Host groups
Pick or create a group to organize hosts in Zabbix's UI.
Example:Databases. - Interfaces
SelectAdd>SNMP. The interface is the network endpoint Zabbix will send queries to.
SetConnect totoDNSand enter the RavenDB server's hostname inDNS name.
UseIPonly when the address is fixed.
Leave the port at the SNMP default of161.
The interface supports either SNMPv2c or SNMPv3:
- SNMPv2c sends a community string (a shared secret) in cleartext. Simpler option, for a trusted local network.
- SNMPv3 adds user authentication and traffic encryption. The right choice when SNMP traffic crosses an untrusted network.
Pick the SNMP version that matches what RavenDB accepts; see SNMP Support for the RavenDB-side settings.
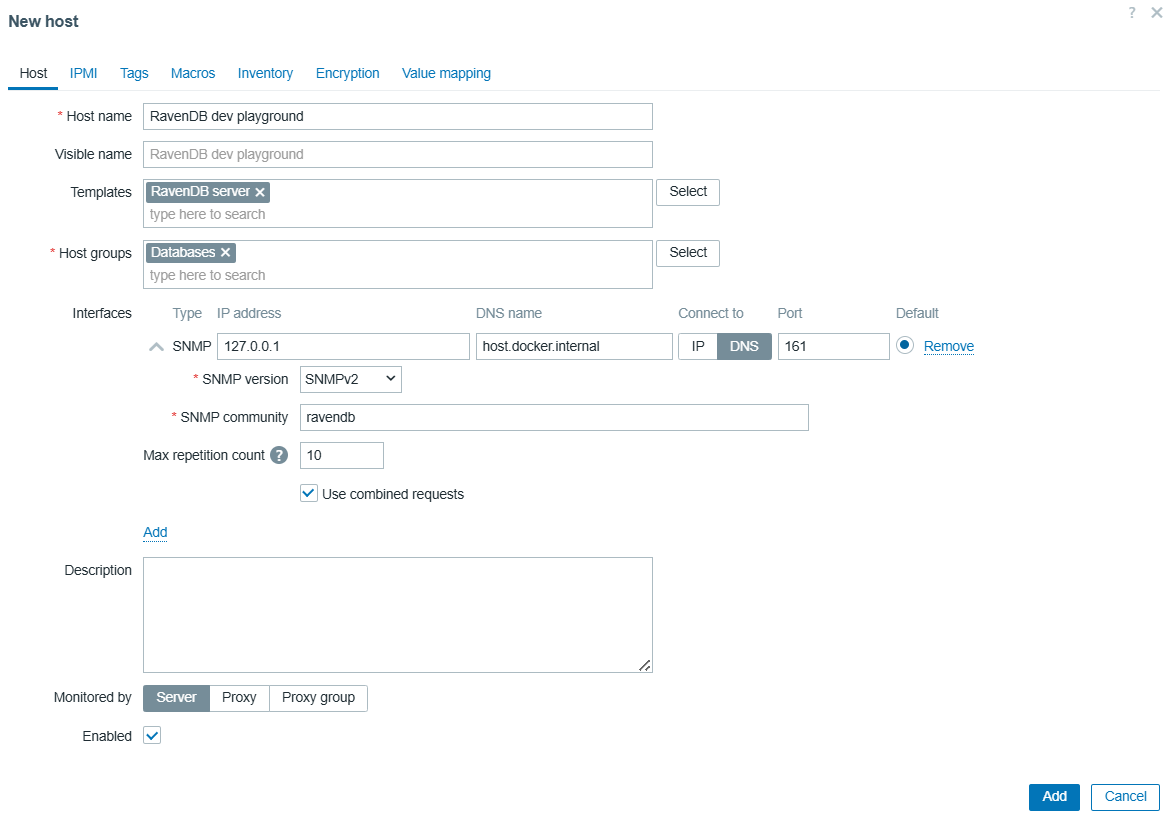
Example: SNMPv2c interface
Set the SNMP version to SNMPv2 and the community string to whatever RavenDB expects (the RavenDB default is ravendb):
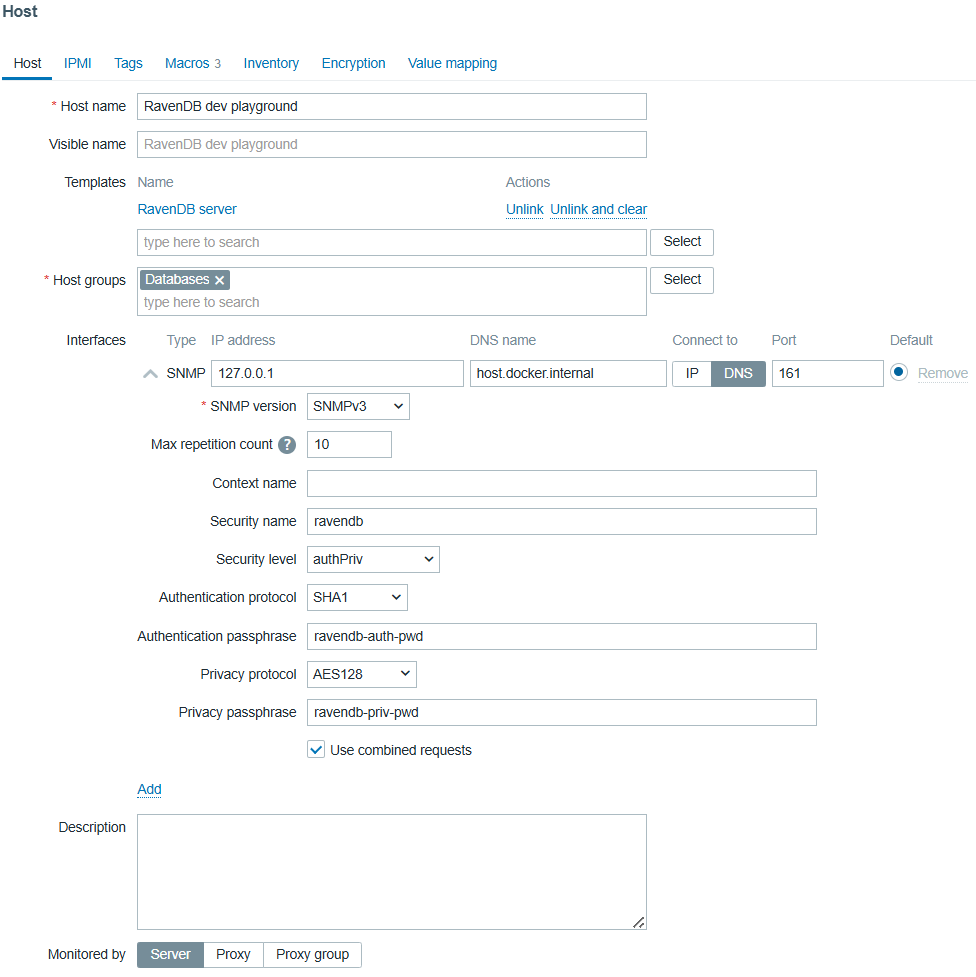
Example: SNMPv3 interface
Set the SNMP version to SNMPv3 and fill in the Security name, Security level, the authentication settings
(protocol and passphrase), and the privacy settings (protocol and passphrase). Each field must match what RavenDB accepts:
Overriding the memory threshold macros
Macros are template variables you can override on each host. The RavenDB template defines three memory-threshold macros, and the template's trigger expressions reference them. Each host can therefore have its own memory thresholds.
The three macros are:
| Macro | Purpose | Template default |
|---|---|---|
{$MANAGED_MEMORY_RECOVERY_THRESHOLD} | Zabbix clears the Managed memory is high alert when managed memory drops below this value. | 2.5G |
{$MANAGED_MEMORY_THRESHOLD} | Zabbix fires the Managed memory is high alert when managed memory exceeds this value. | 3G |
{$UNMANAGED_MEMORY_THRESHOLD} | Zabbix fires the unmanaged-memory alert when unmanaged memory exceeds this value. | 1G |
The default values are conservative. For a production host, the community-template authors recommend setting:
{$MANAGED_MEMORY_RECOVERY_THRESHOLD}: 65% of total machine RAM.{$MANAGED_MEMORY_THRESHOLD}: 75% of total machine RAM.{$UNMANAGED_MEMORY_THRESHOLD}: 25% of total machine RAM.
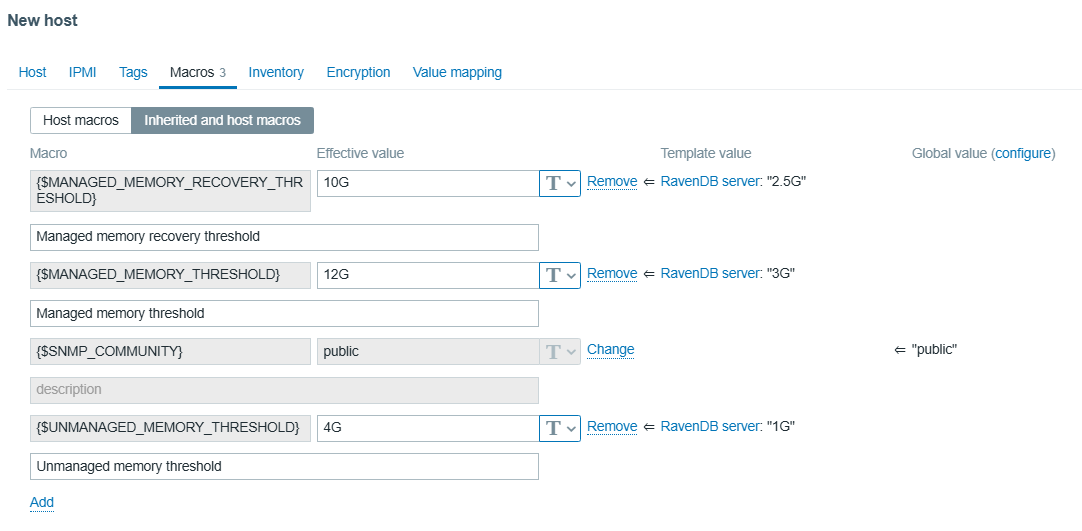
To override on a host, open the host's Macros tab, switch to Inherited and host macros, and select
Change next to each macro to set a host-specific value. For a 16 GB RAM host this might look like:
Confirming Zabbix is collecting values
After you save the host, Zabbix starts running the template's SNMP queries against it. Each item has its own polling interval; most produce a first value within a minute or two.
To see the metrics arriving, open Monitoring > Latest data. Each row is one item,
showing the most recent value Zabbix received and how recently. Set the Hosts filter to your RavenDB host and select Apply:
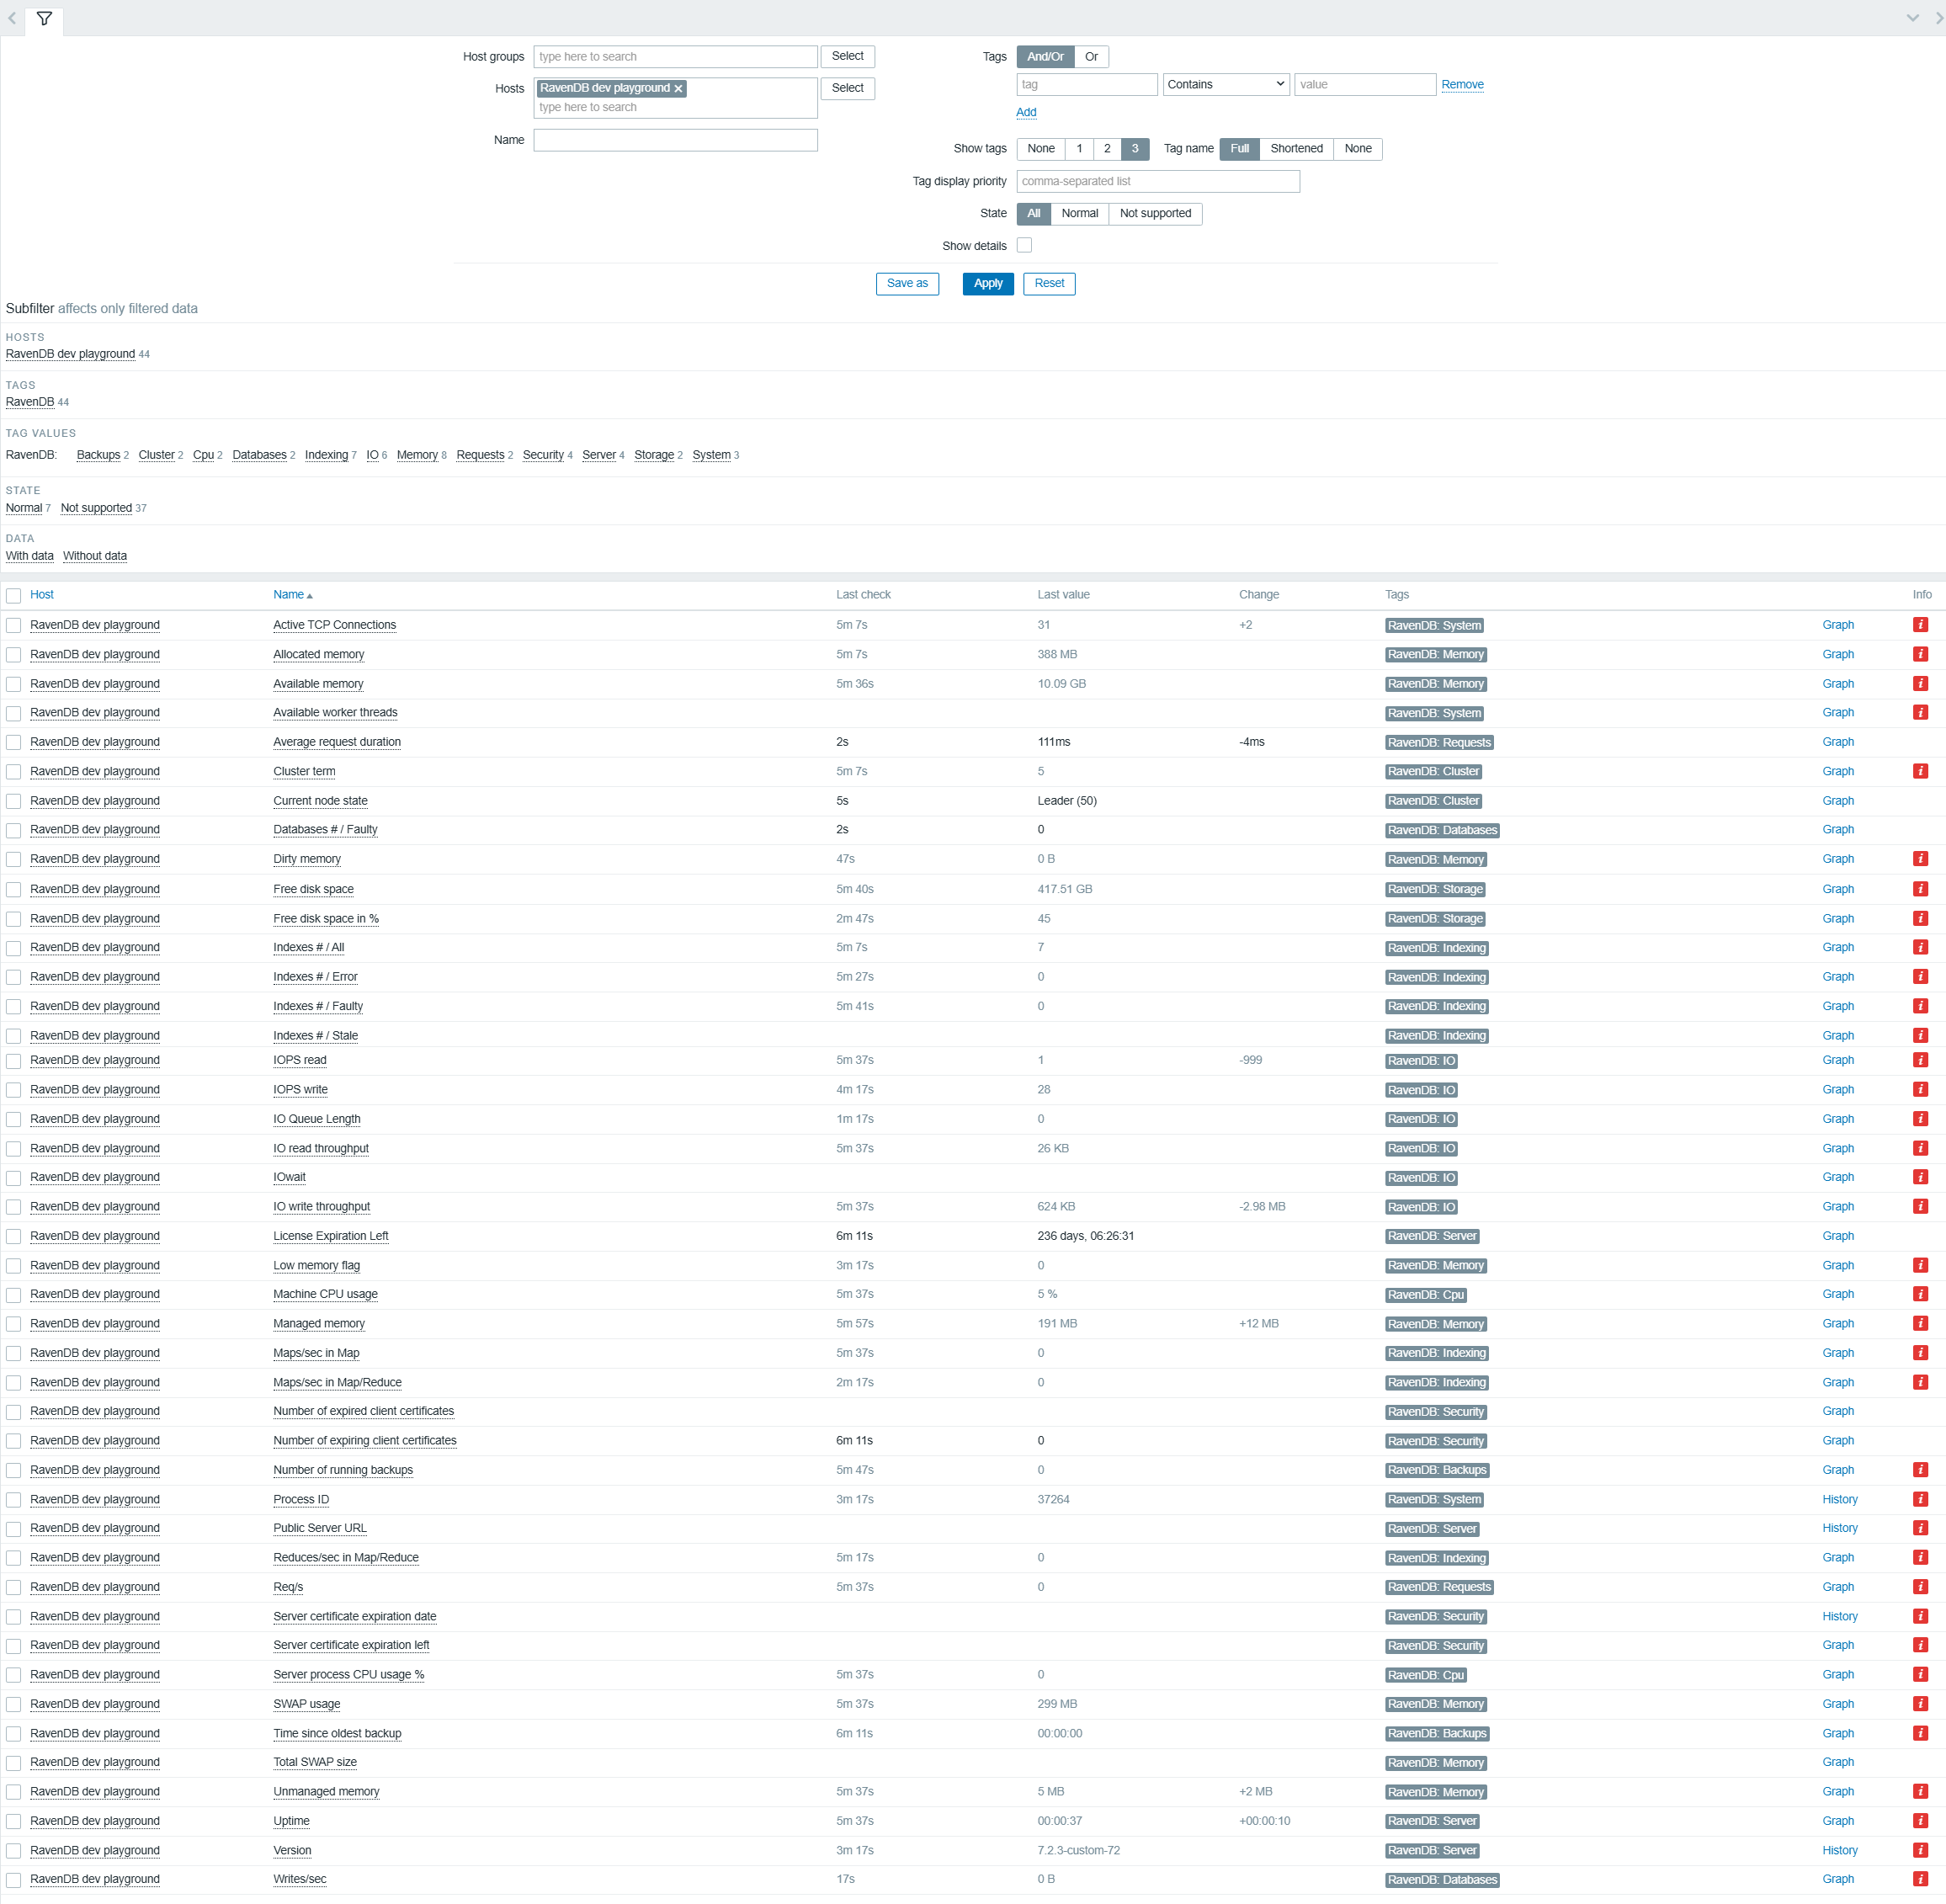
Server-level items such as uptime, CPU usage, memory, disk, cluster state, and certificate expiration
show values as soon as the RavenDB process is running, even if no databases exist on the server.
Database-level items (database count, index count, writes per second) stay at zero, or remain blank, until you create a database on RavenDB.
If every row still shows No data after a couple of minutes, Zabbix is probably not reaching RavenDB. Check, in order:
- The SNMP listener is up on the RavenDB host. From PowerShell on the RavenDB host,
run
Get-NetUDPEndpoint | Where-Object { $_.LocalPort -eq 161 }and confirm an entry exists. - The Zabbix server can reach the RavenDB host on UDP port 161. Firewalls and Docker networking
are the common culprits; from inside the Zabbix server container, an
snmpgetagainst the RavenDB host should return a value. - The community string (SNMPv2c) or the SNMPv3 credentials on the host's SNMP interface match what RavenDB accepts.
Triggers
A trigger in Zabbix is an alert rule defined against one or more items.
Zabbix evaluates each trigger's expression every time a new value arrives for one of its items;
when the expression matches (for example, the last value is greater than X, or no value has arrived for N minutes),
Zabbix switches the trigger to a PROBLEM state.
Triggers included with the template
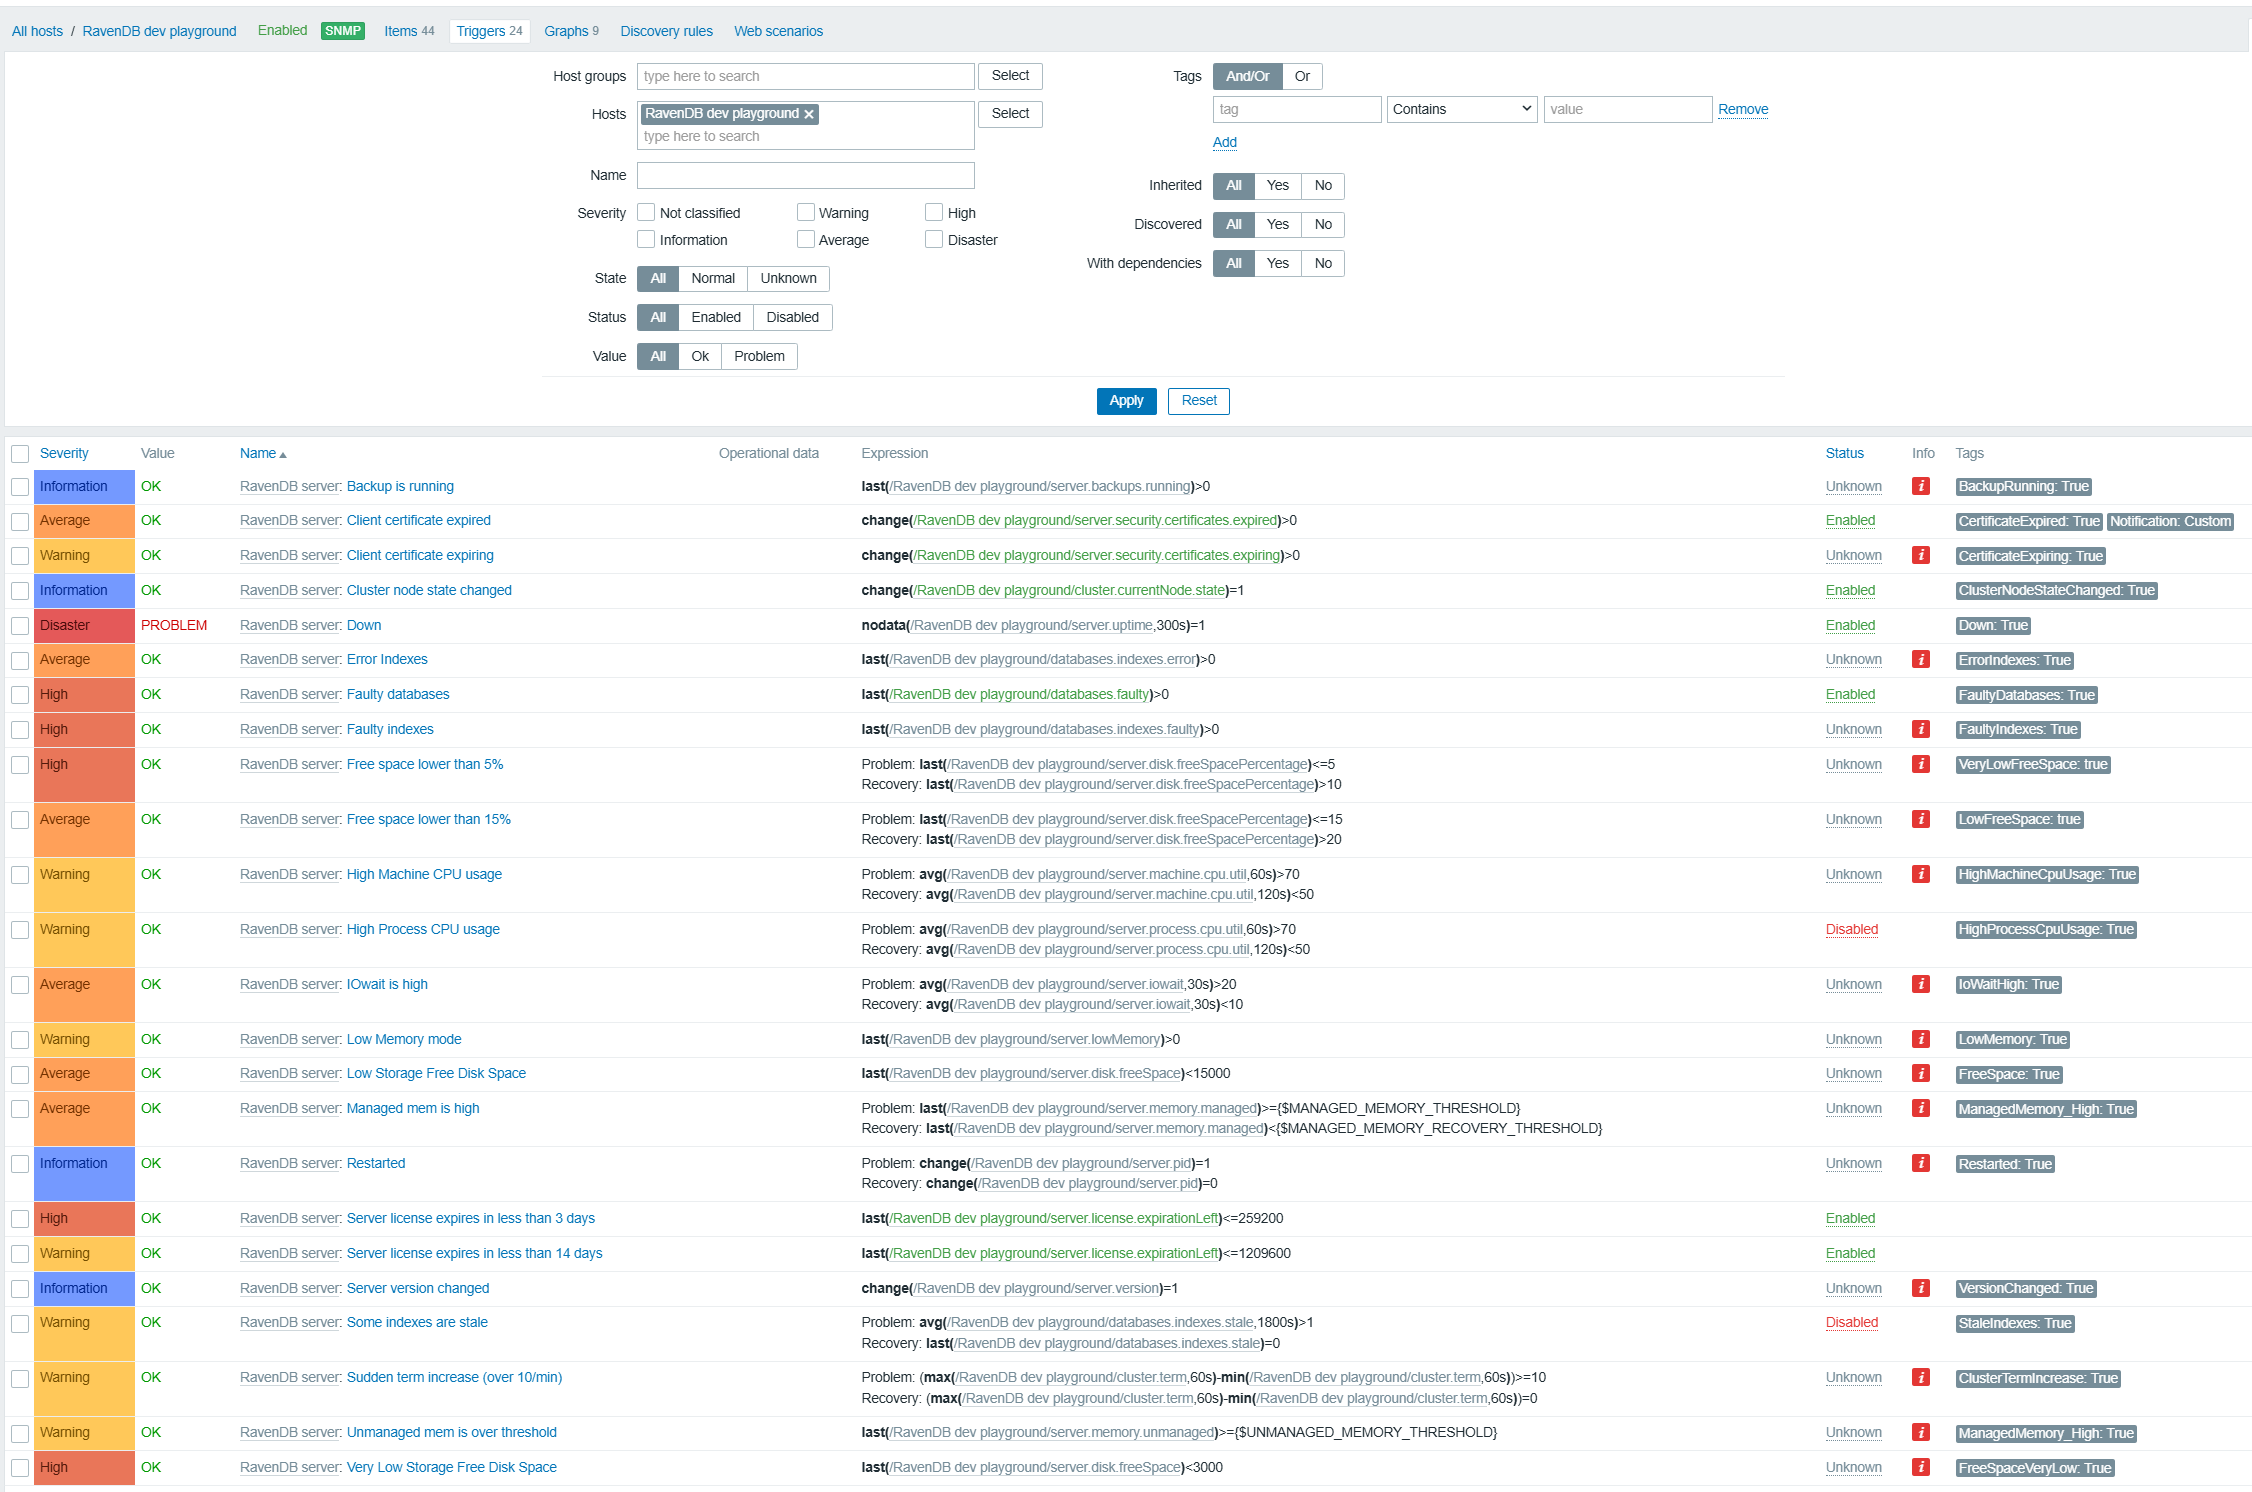
The RavenDB template includes triggers for common operational concerns.
When you link the template to a host, all the triggers defined by the template are attached to
the host, providing you with a working set of alerts so you don't have to define them yourself.
To view the triggers attached to your host, open Data collection > Hosts and select the Triggers count on the host's row:
Grouped by type:
| Type | Triggers |
|---|---|
| Availability | Server down, server restart, server version change, cluster node state change. |
| Storage | Low disk space at 5%, 15%, and absolute MB thresholds. |
| Memory | Managed and unmanaged memory exceeding the macro thresholds, low-memory mode active. |
| CPU and IO | Machine CPU usage, process CPU usage, IOwait. |
| Indexes | Faulty, error, or stale indexes. |
| Databases | Faulty databases. |
| Cluster | Sudden term increase. |
| Backups | Backup running. |
| License and certificates | Server license about to expire, client certificate expired or expiring. |
The full list of trigger names and expressions is in the community template README.
Adding a custom trigger
You may want an alert for an event the template leaves out, like request load, for example.
To fill this gap, add your own trigger that uses one of the metrics the template already collects.
To add a trigger to your host:
- Open the host's
Triggerspage and selectCreate trigger. - Name the trigger, choose its severity, and enter an expression that references a template item.
- Select
Addto save.
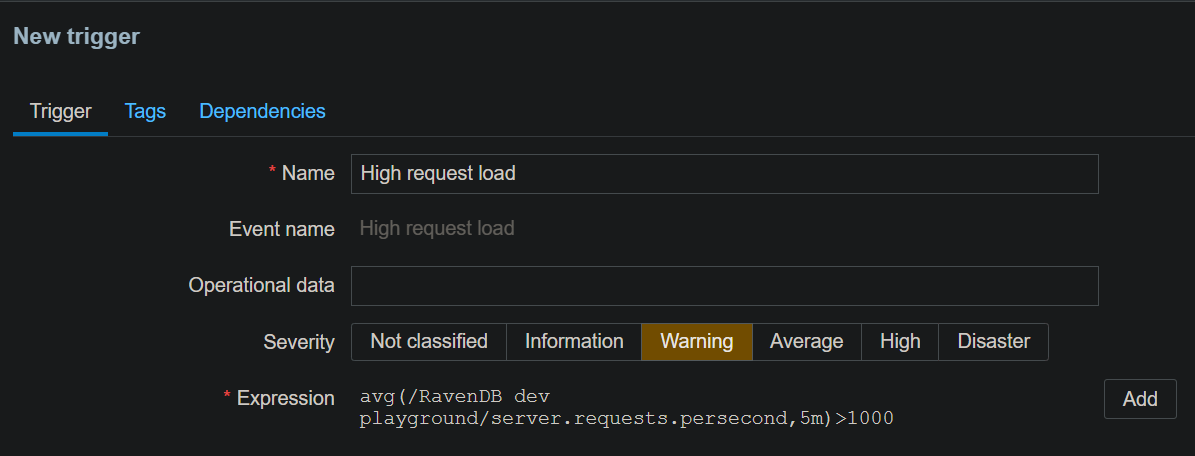
Example: alert on sustained high request load
This expression raises the trigger when the request rate, averaged over five minutes, exceeds the value you set (here, 1000 requests per second):
avg(/RavenDB dev playground/server.requests.persecond,5m)>1000
Replace RavenDB dev playground with your host's name, server.requests.persecond with the item you want to watch, and 1000 with your threshold.
Zabbix evaluates the expression each time a new value arrives for the item, and raises the trigger to PROBLEM when the expression matches, exactly as it does for the template's own triggers.
Setting up notifications
A trigger that switches to PROBLEM appears on Zabbix's dashboard and problem list, but Zabbix does not contact you about it on its own.
To have Zabbix send a message when a problem starts, set up notifications.
To set up notifications, configure three things:
- A media type
Defines how Zabbix sends a message: email, a webhook to Slack, or a custom script.
OpenAlerts>Media typesand configure a type. The built-inEmailtype only needs your SMTP server details. - A delivery address on the recipient's user
Tells Zabbix where to send.
OpenUsers>Users, select the user, open theMediatab, and add an address for the media type you configured. - A trigger action
Connects a problem to the delivery.
OpenAlerts>Actions>Trigger actionsand selectCreate action.
On theActiontab, give the action a name.
On theOperationstab, selectAddand create aSend messageoperation: setSend to usersandSend to media type.
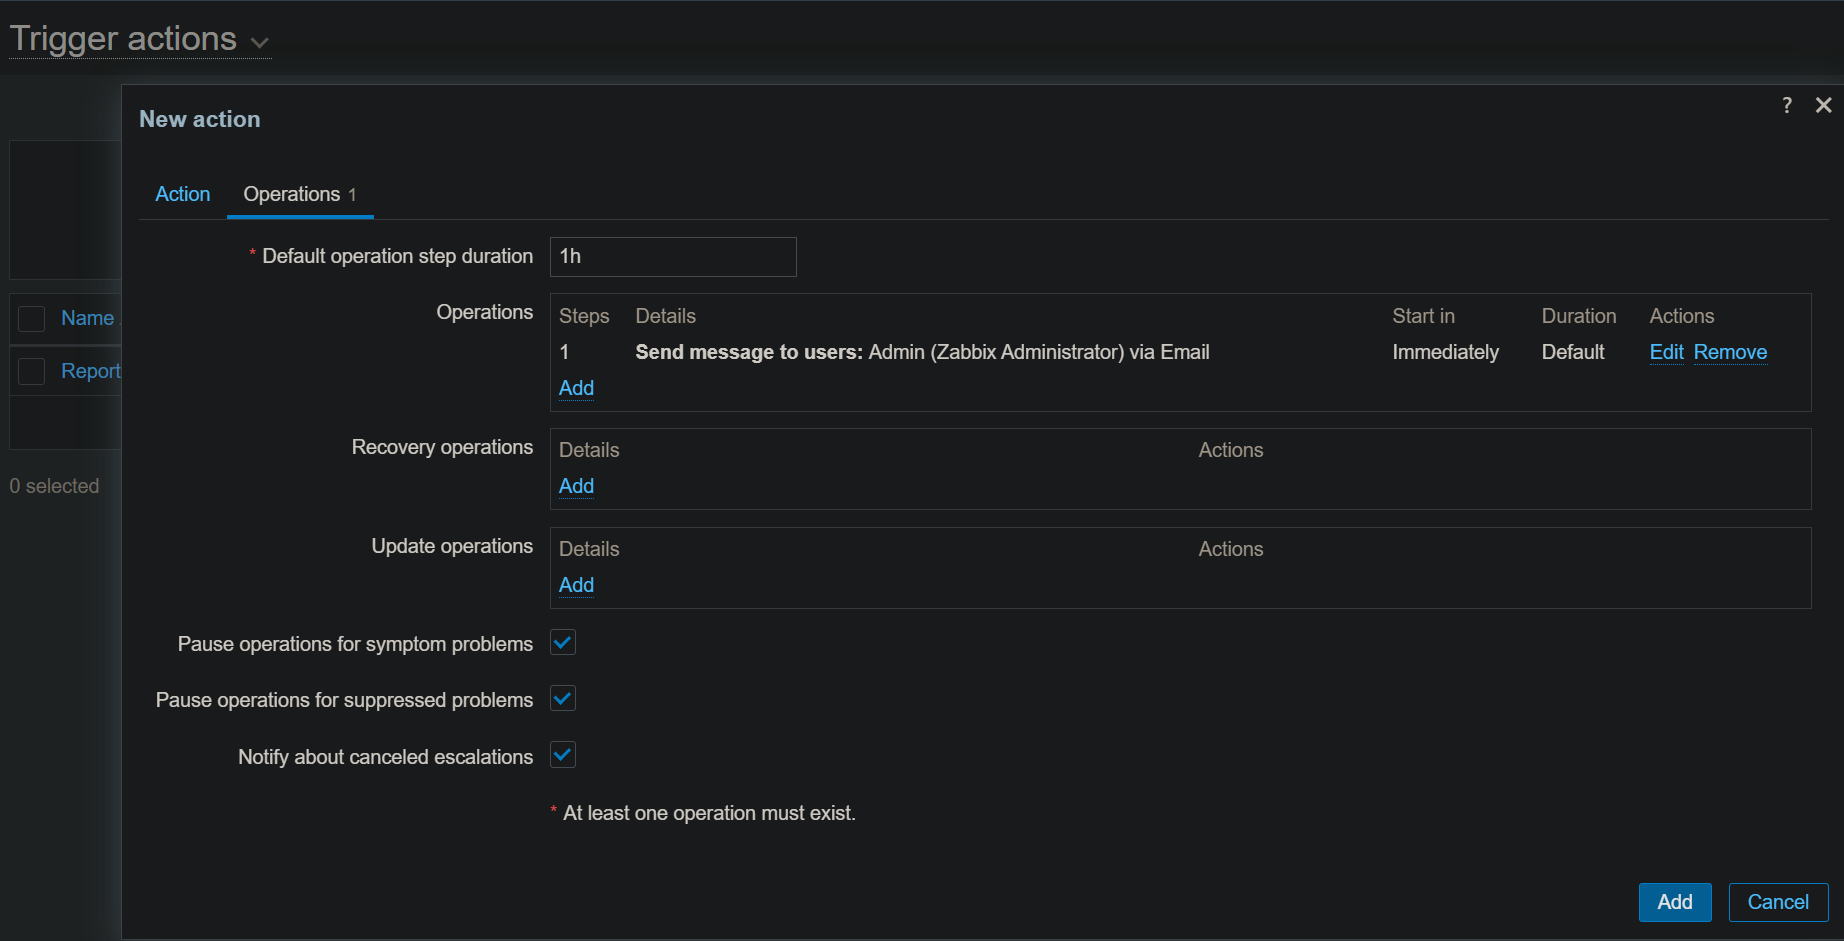
Once the action is enabled, Zabbix sends a message every time a matching trigger switches to PROBLEM, and again on recovery if you add a recovery operation.
For the full set of options, including escalation steps and message templating, see Zabbix's notifications documentation.